2021 NYSERDA Tenant Energy ML Data Challenge (2nd Place)
We would like to thank PropTech Challenge, REBNY, NYSERDA, Connected RE, and all the members involved in this challenge. We are extremely proud that we got to participate this year.
The challenge, comprised of 7 well thought out questions allowed our ML/AI building research team to deploy their algorithms and skills to solve this challenge.
Read more below!
Data Room
Download: Full Presentation (PDF)
Question 1 of 7
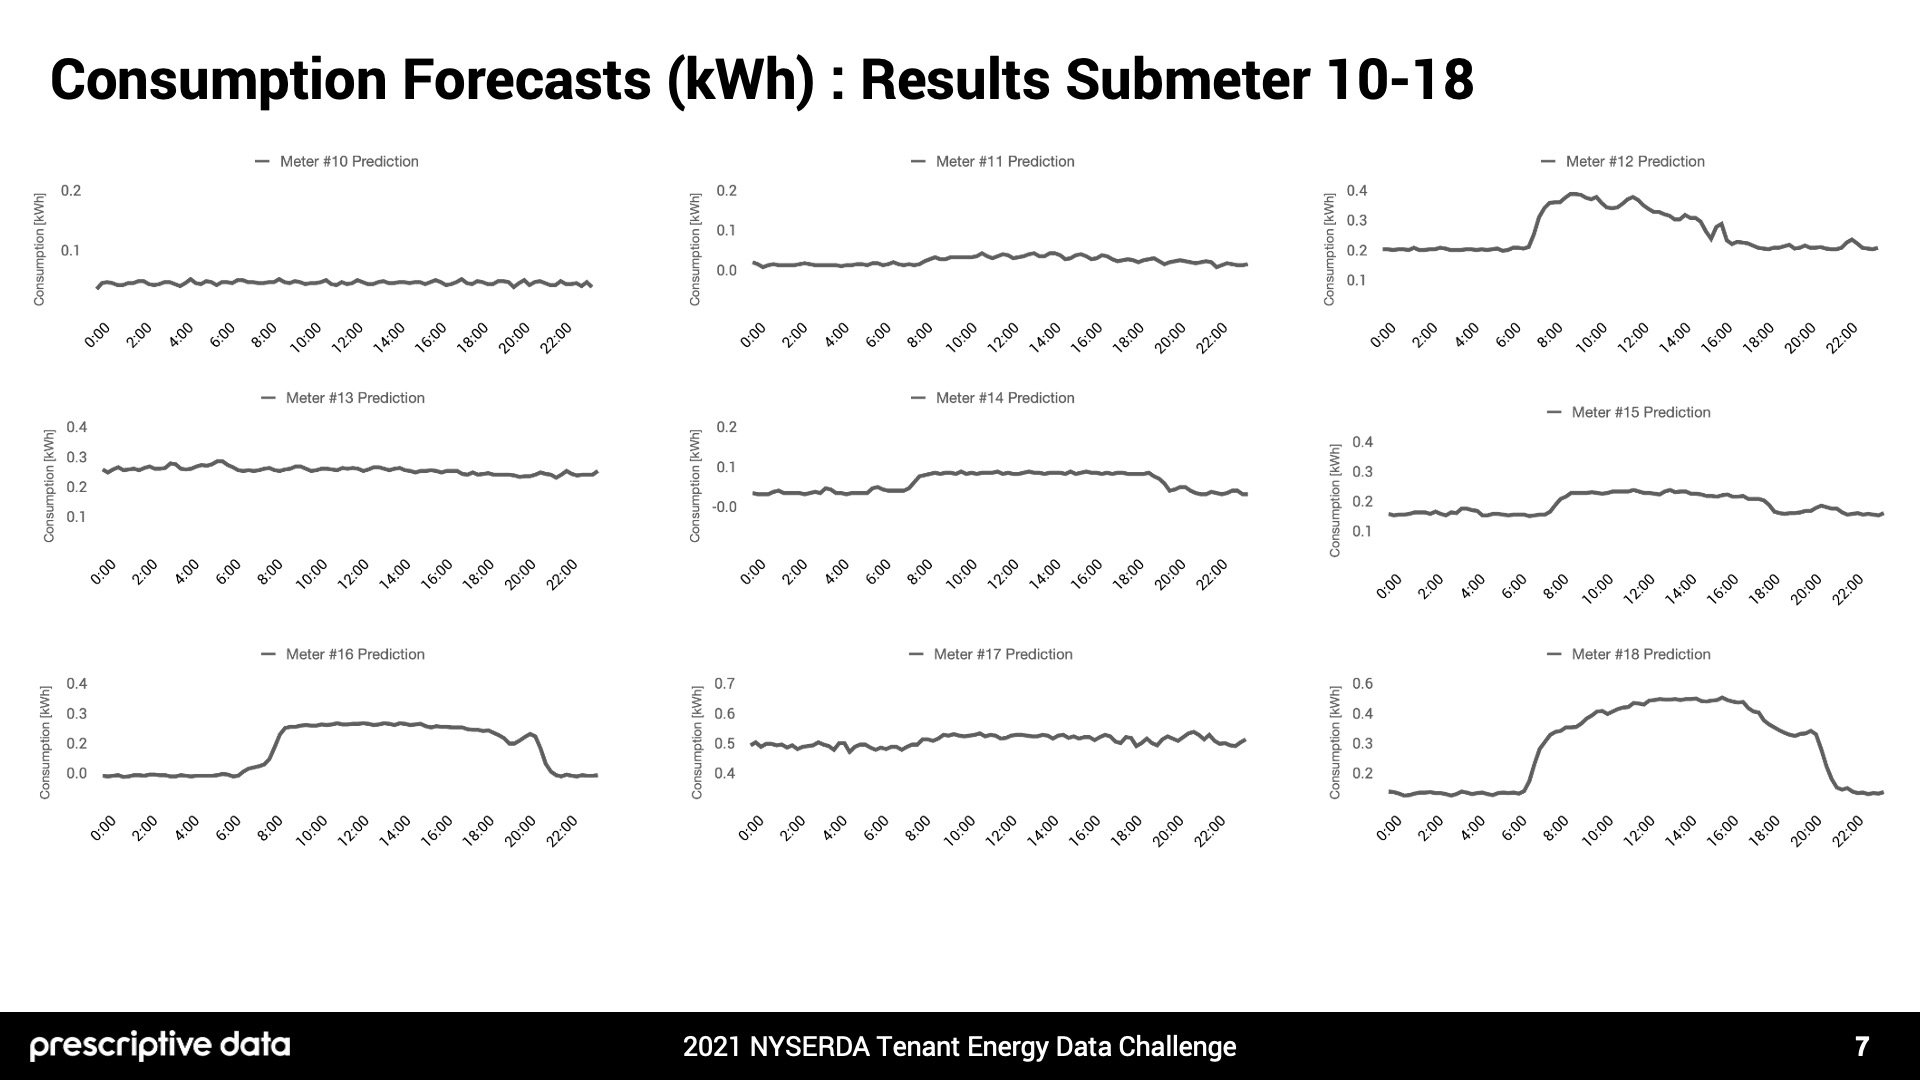
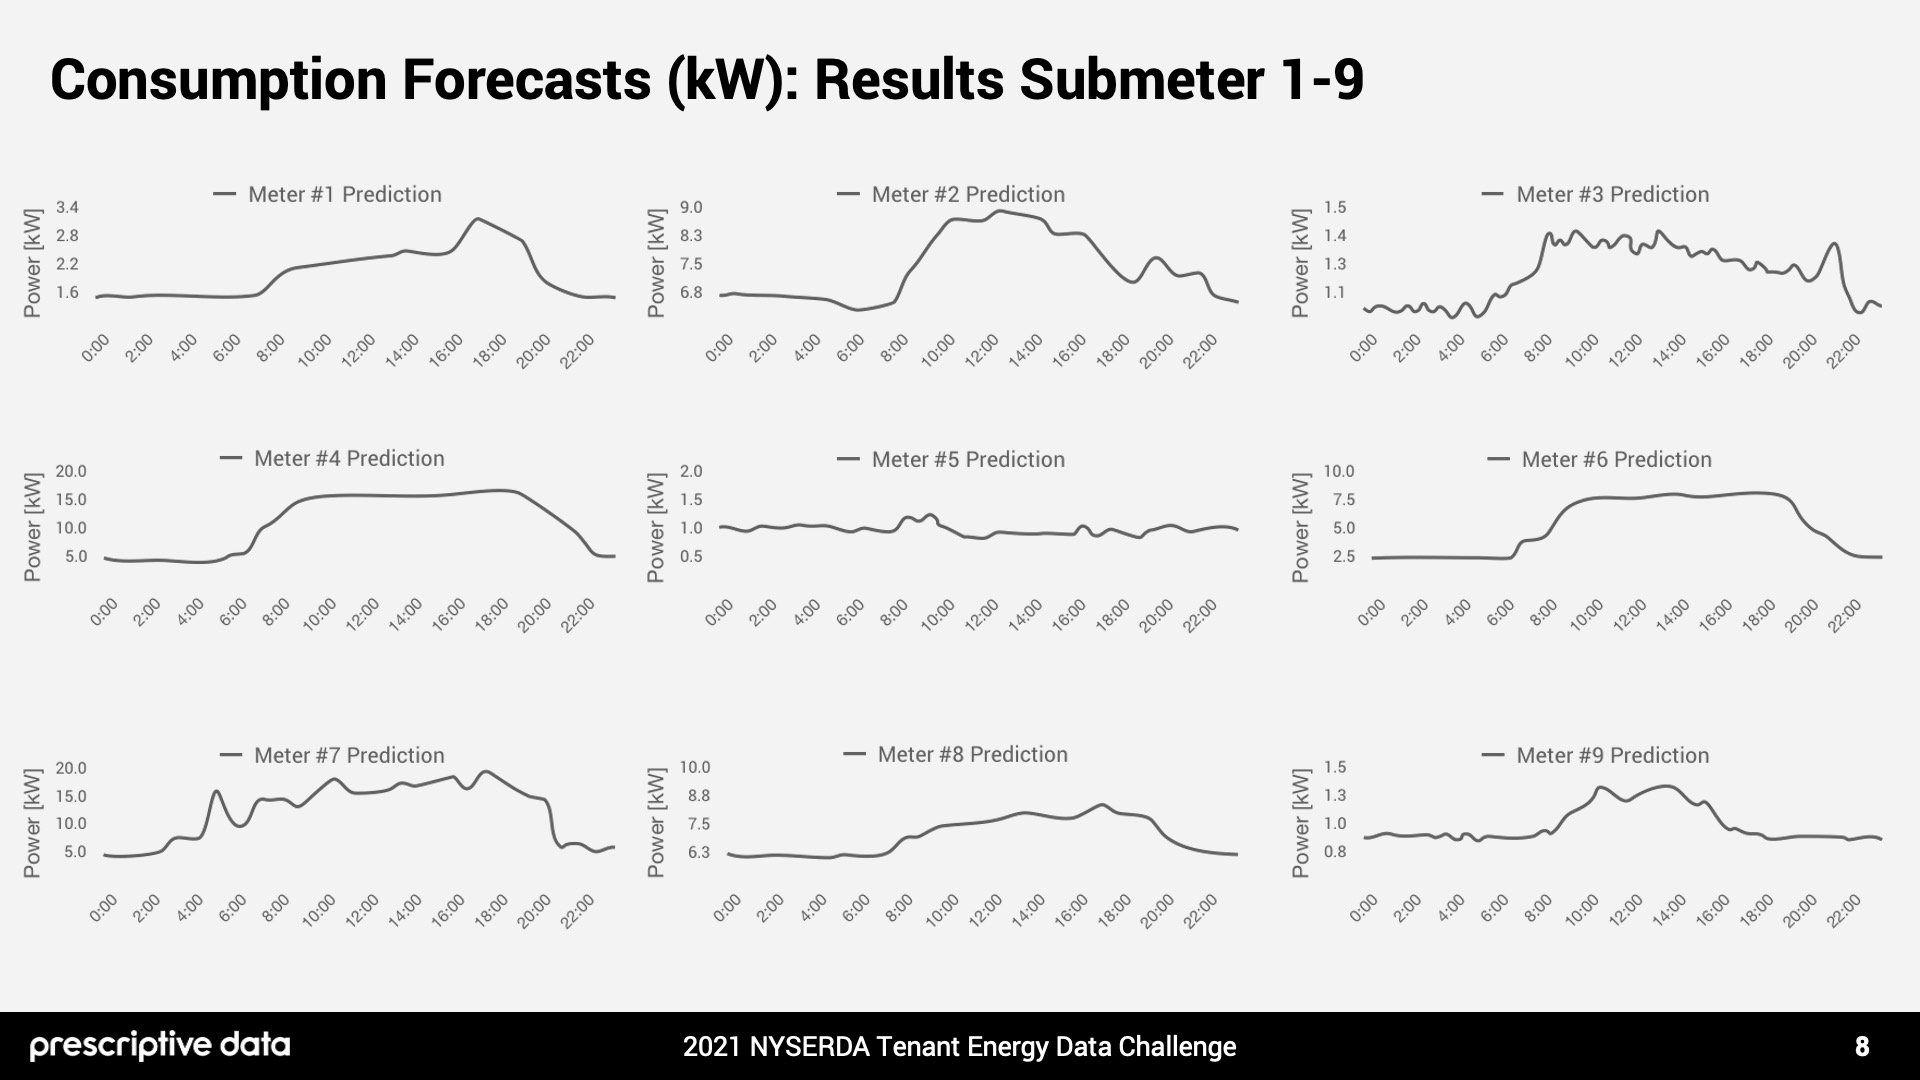
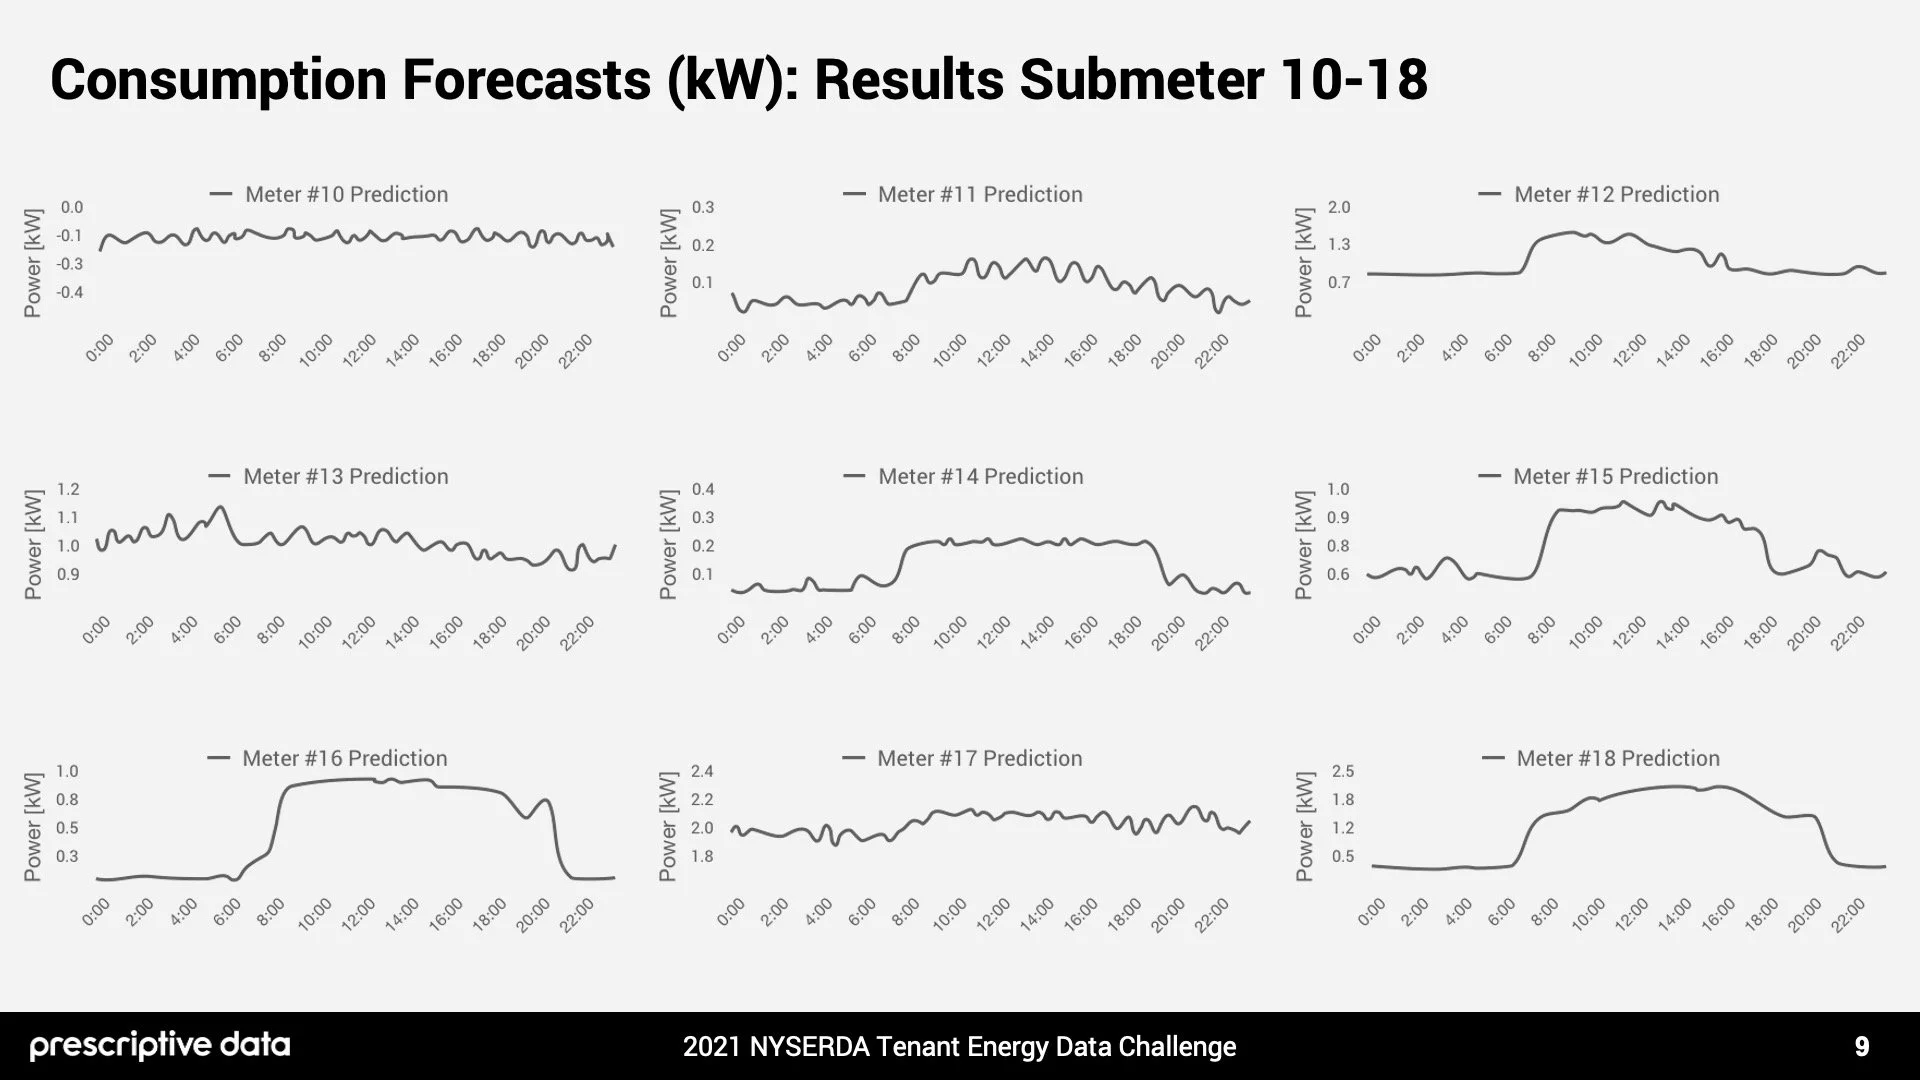
What is your forecasted consumption across all 18 tenant usage meters for the 24 hours of 8/31/20 in 15-minute intervals (1728 predictions)?
(Click the Left and Right Arrows Below To View Presentation Section)
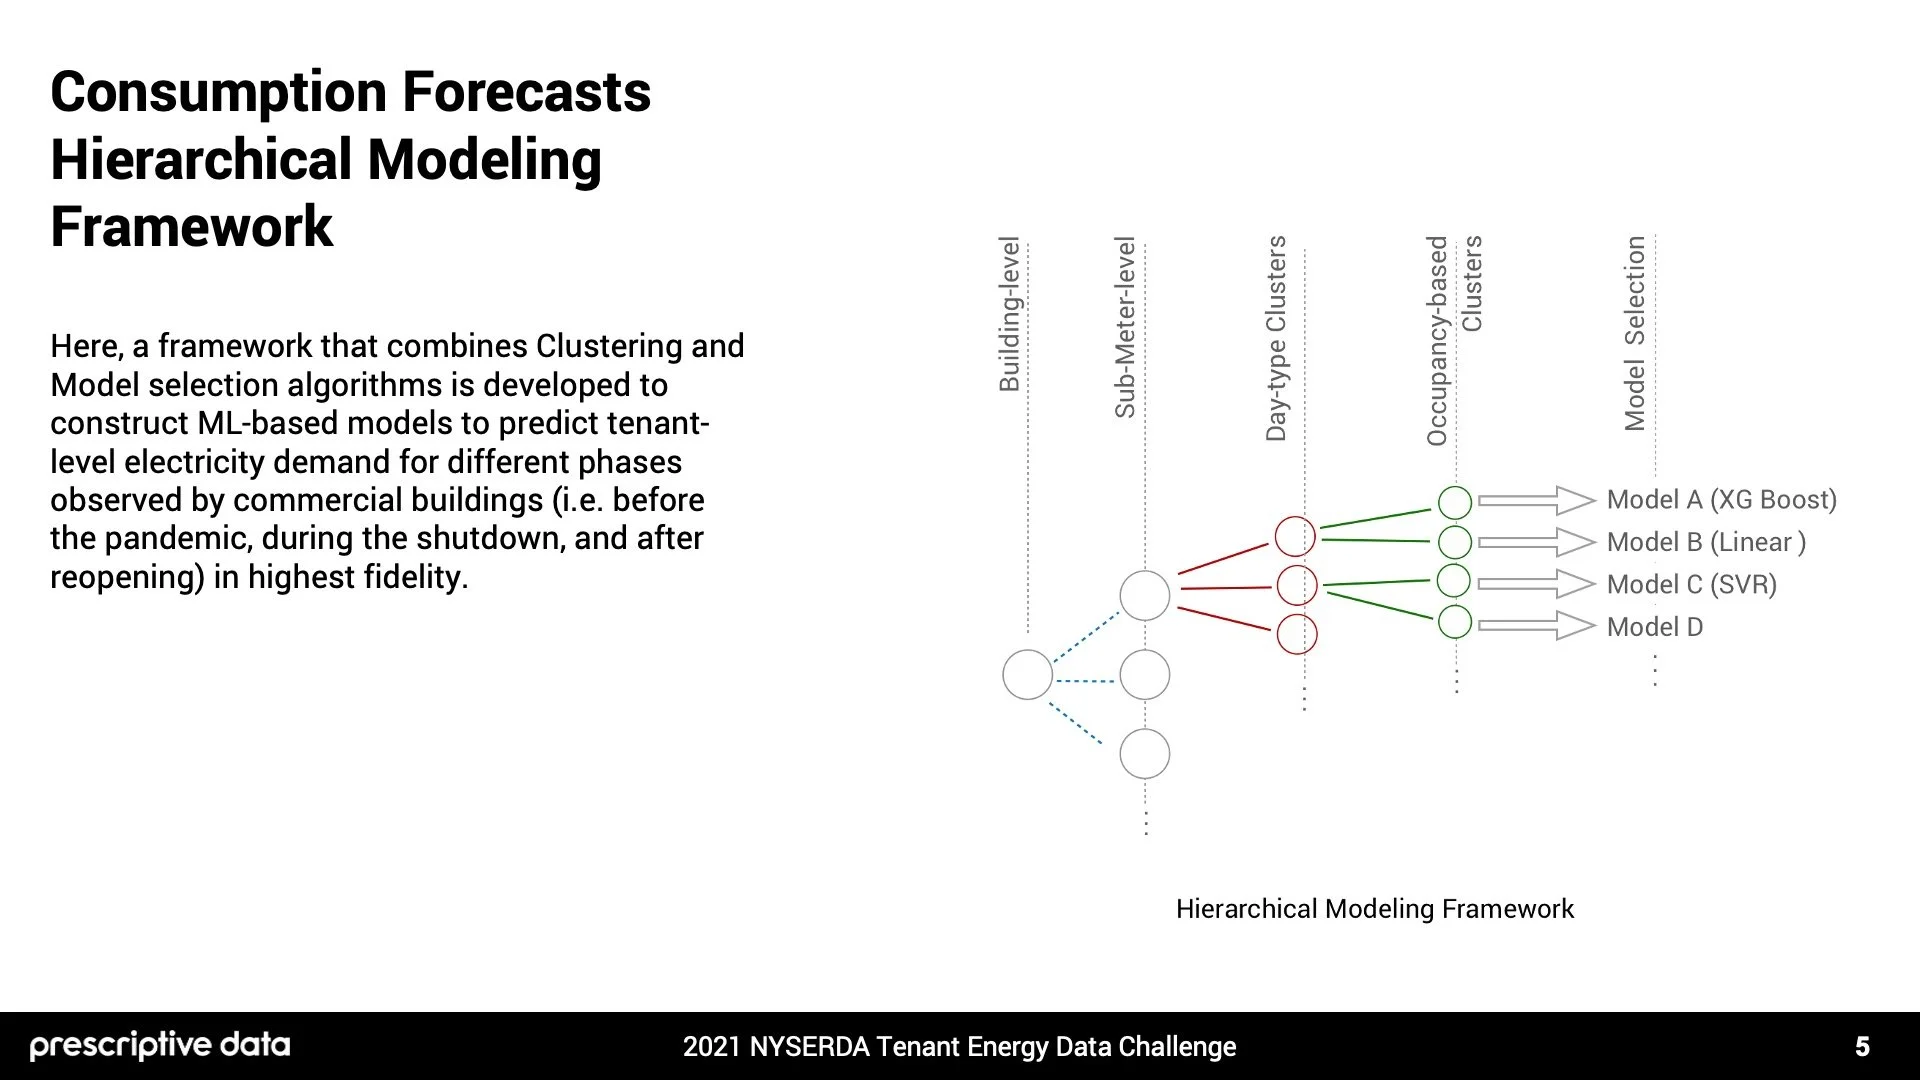
First, we developed a formulation that combines:
1 - Clustering
2 - Model selection algorithms
To construct ML-based models to predict building-level and tenant-level electricity demand.
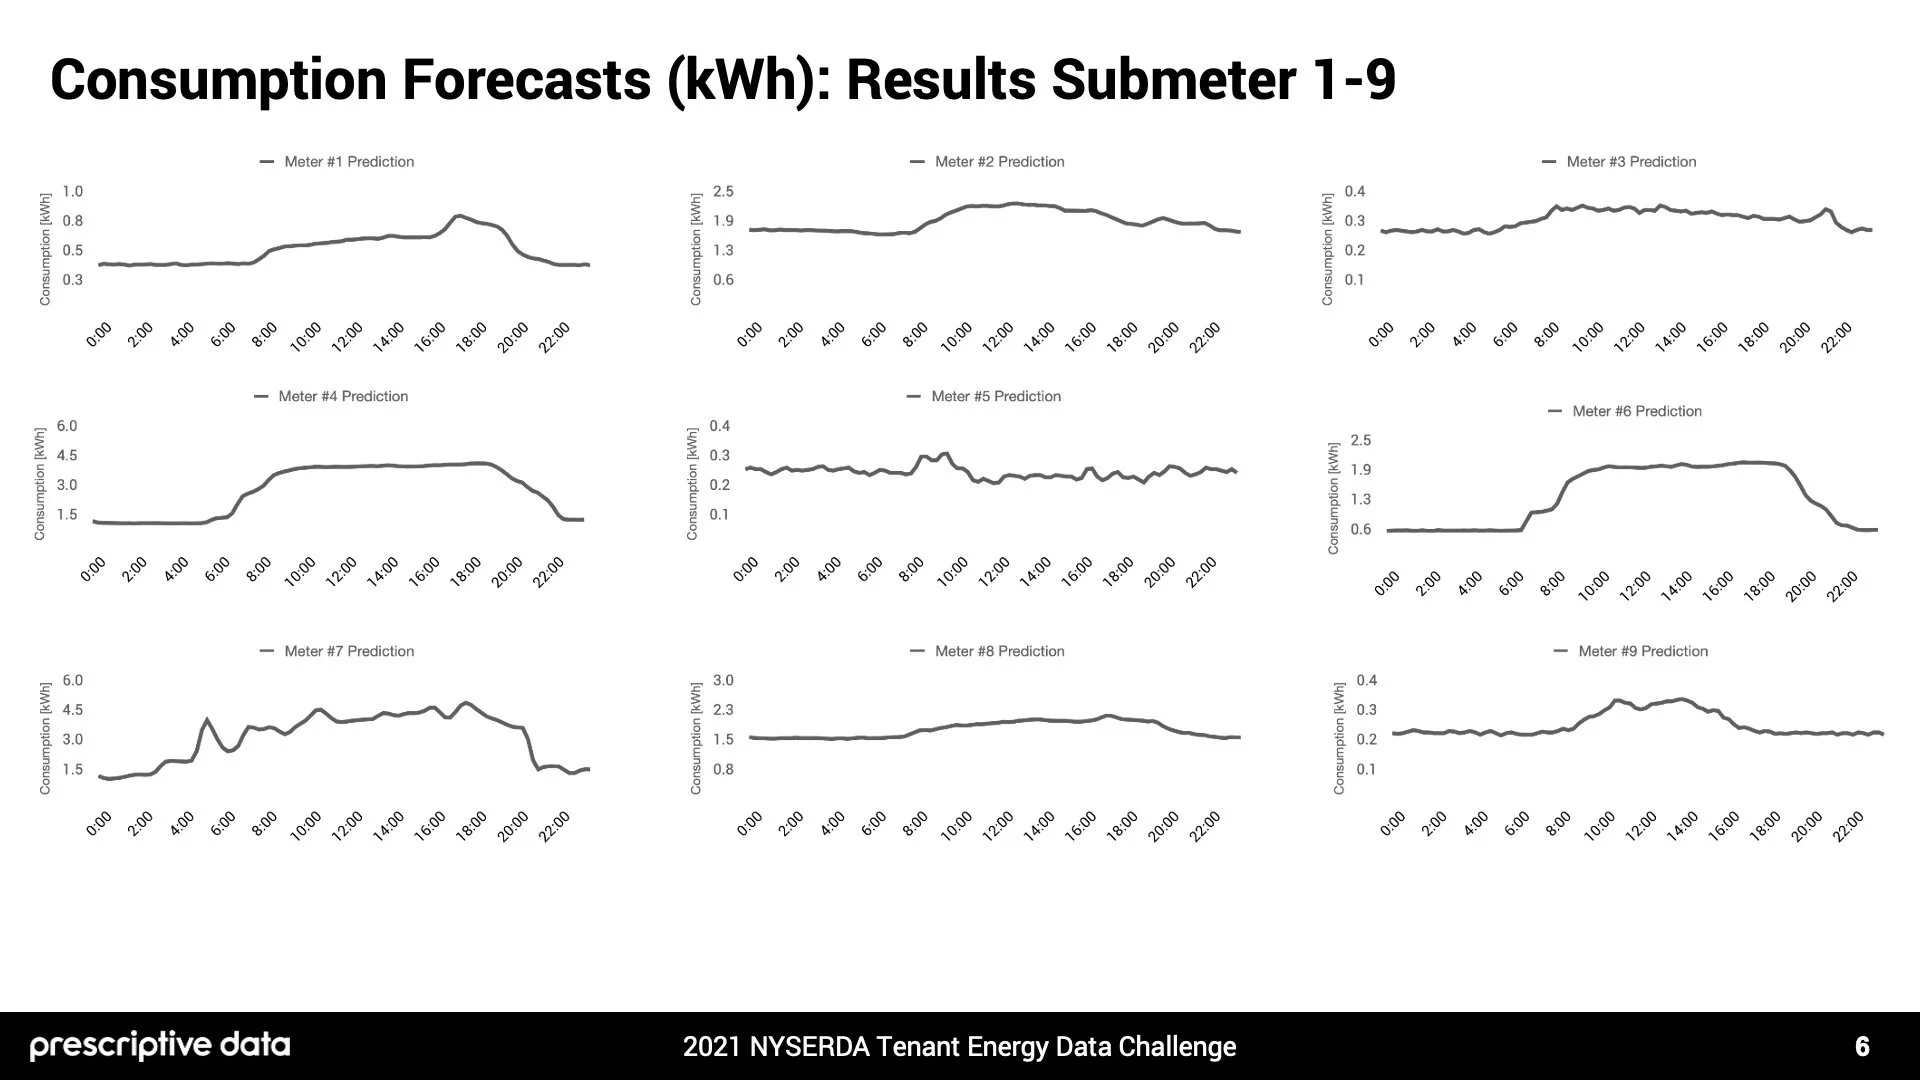
This allowed us to forecast and predict consumption data for all 18 submeters on August 31st, 2020, with 15-minute granularity.
Question 2 of 7
How correlated are building-wide occupancy and tenant consumption?
(Click the Left and Right Arrows Below To View Presentation Section)
Download: Full Presentation (PDF)
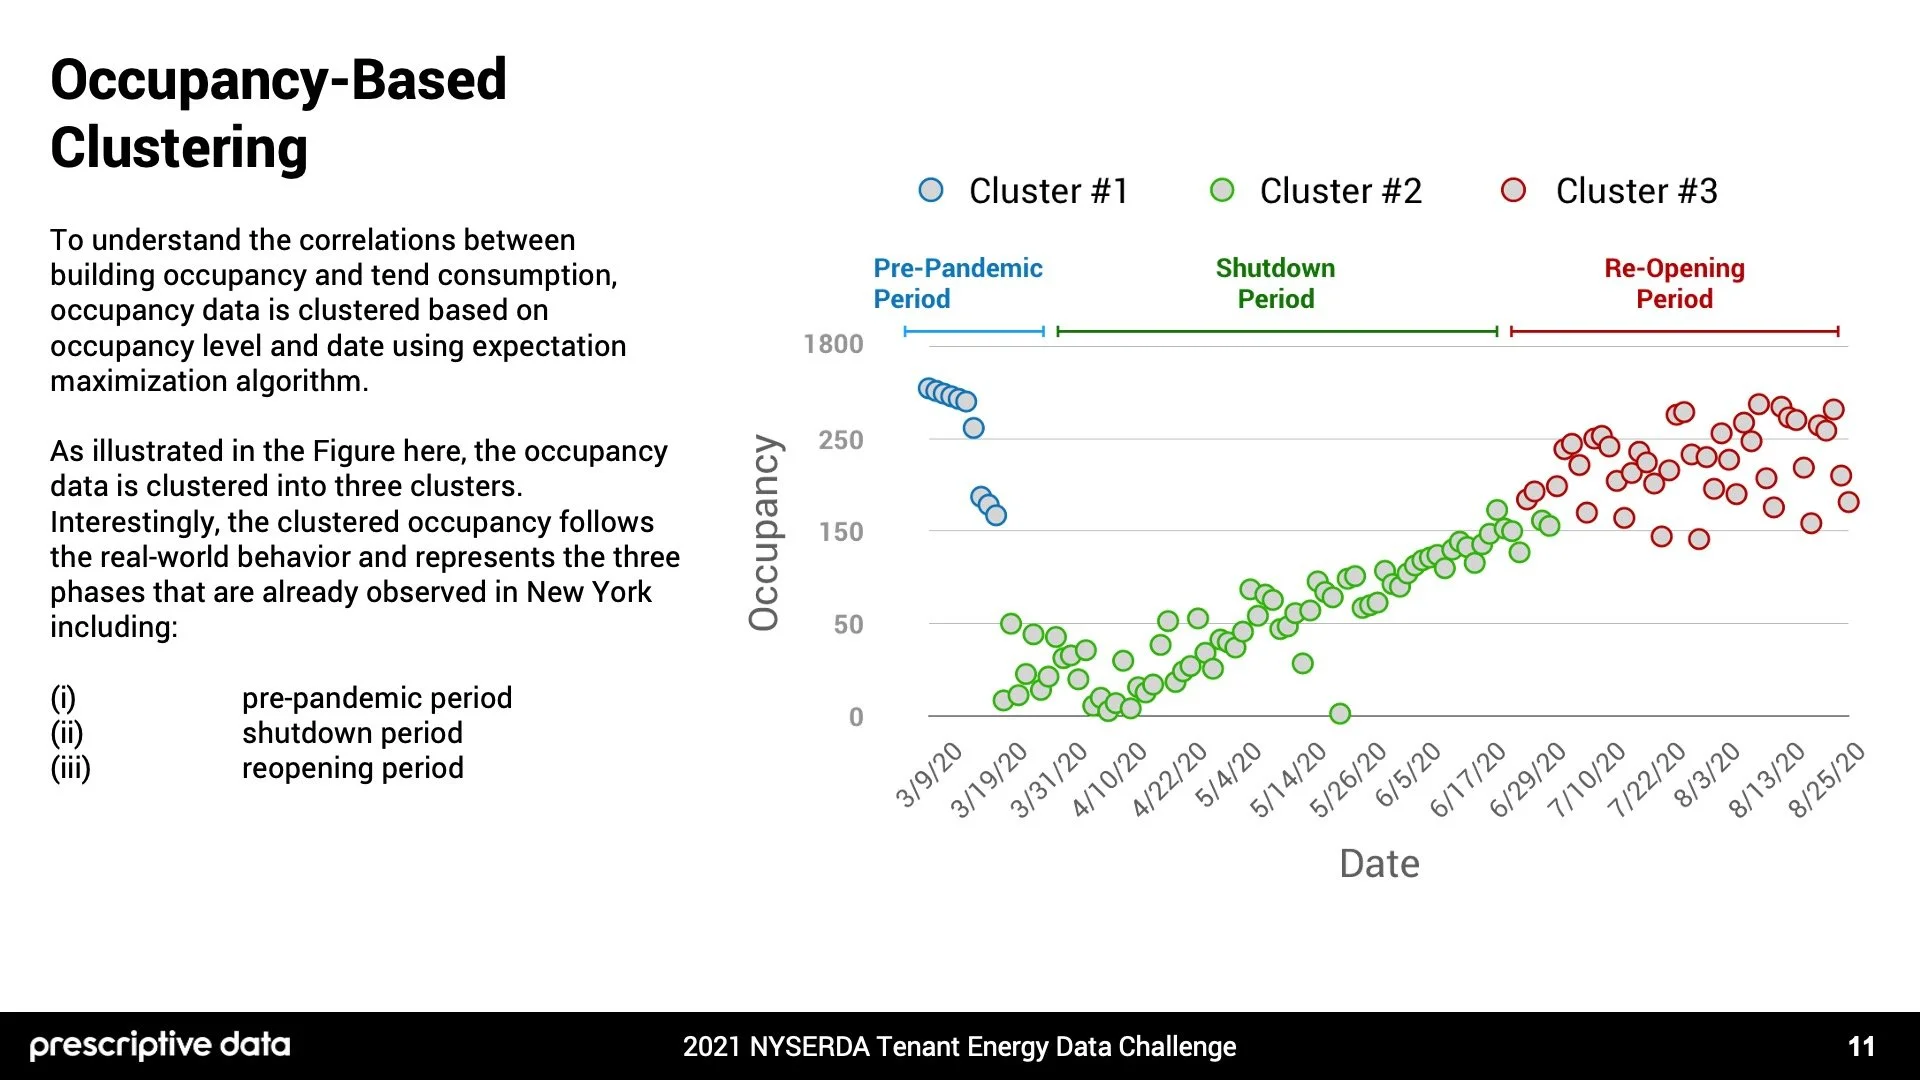
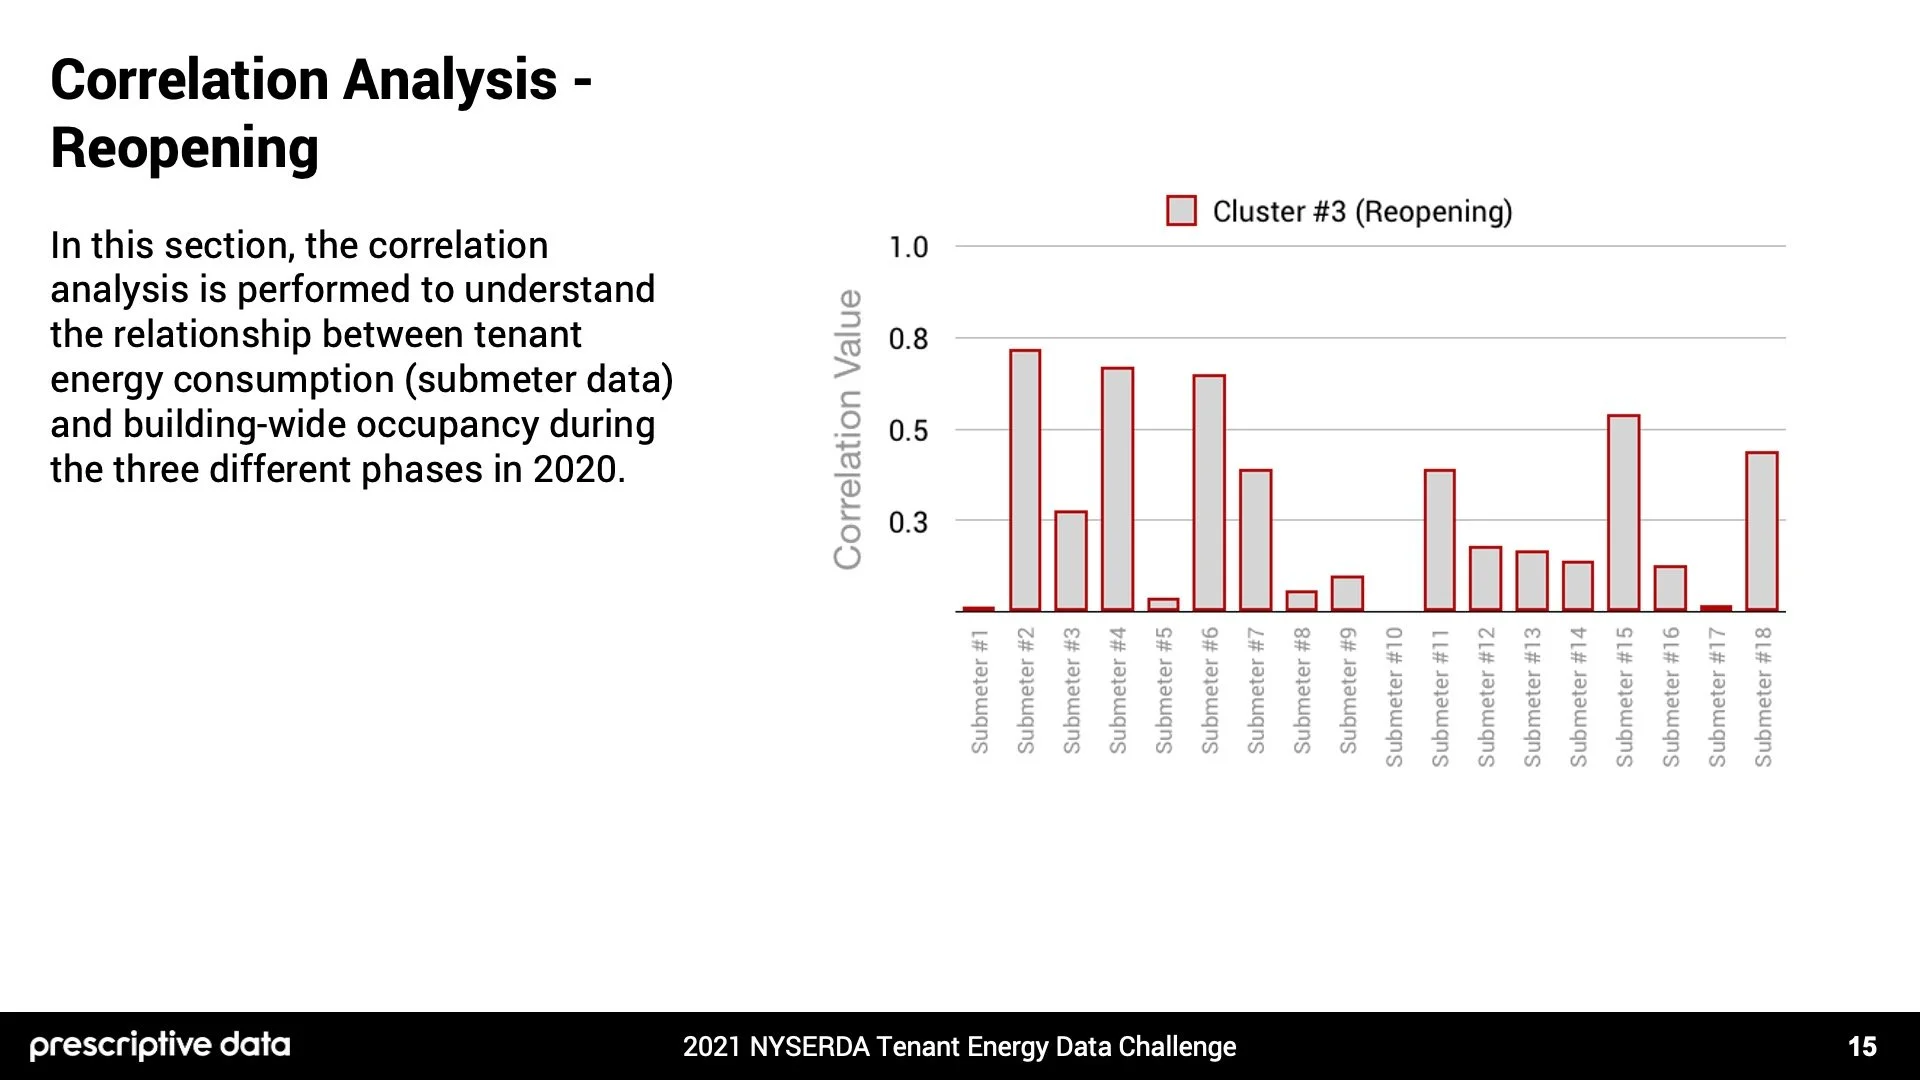
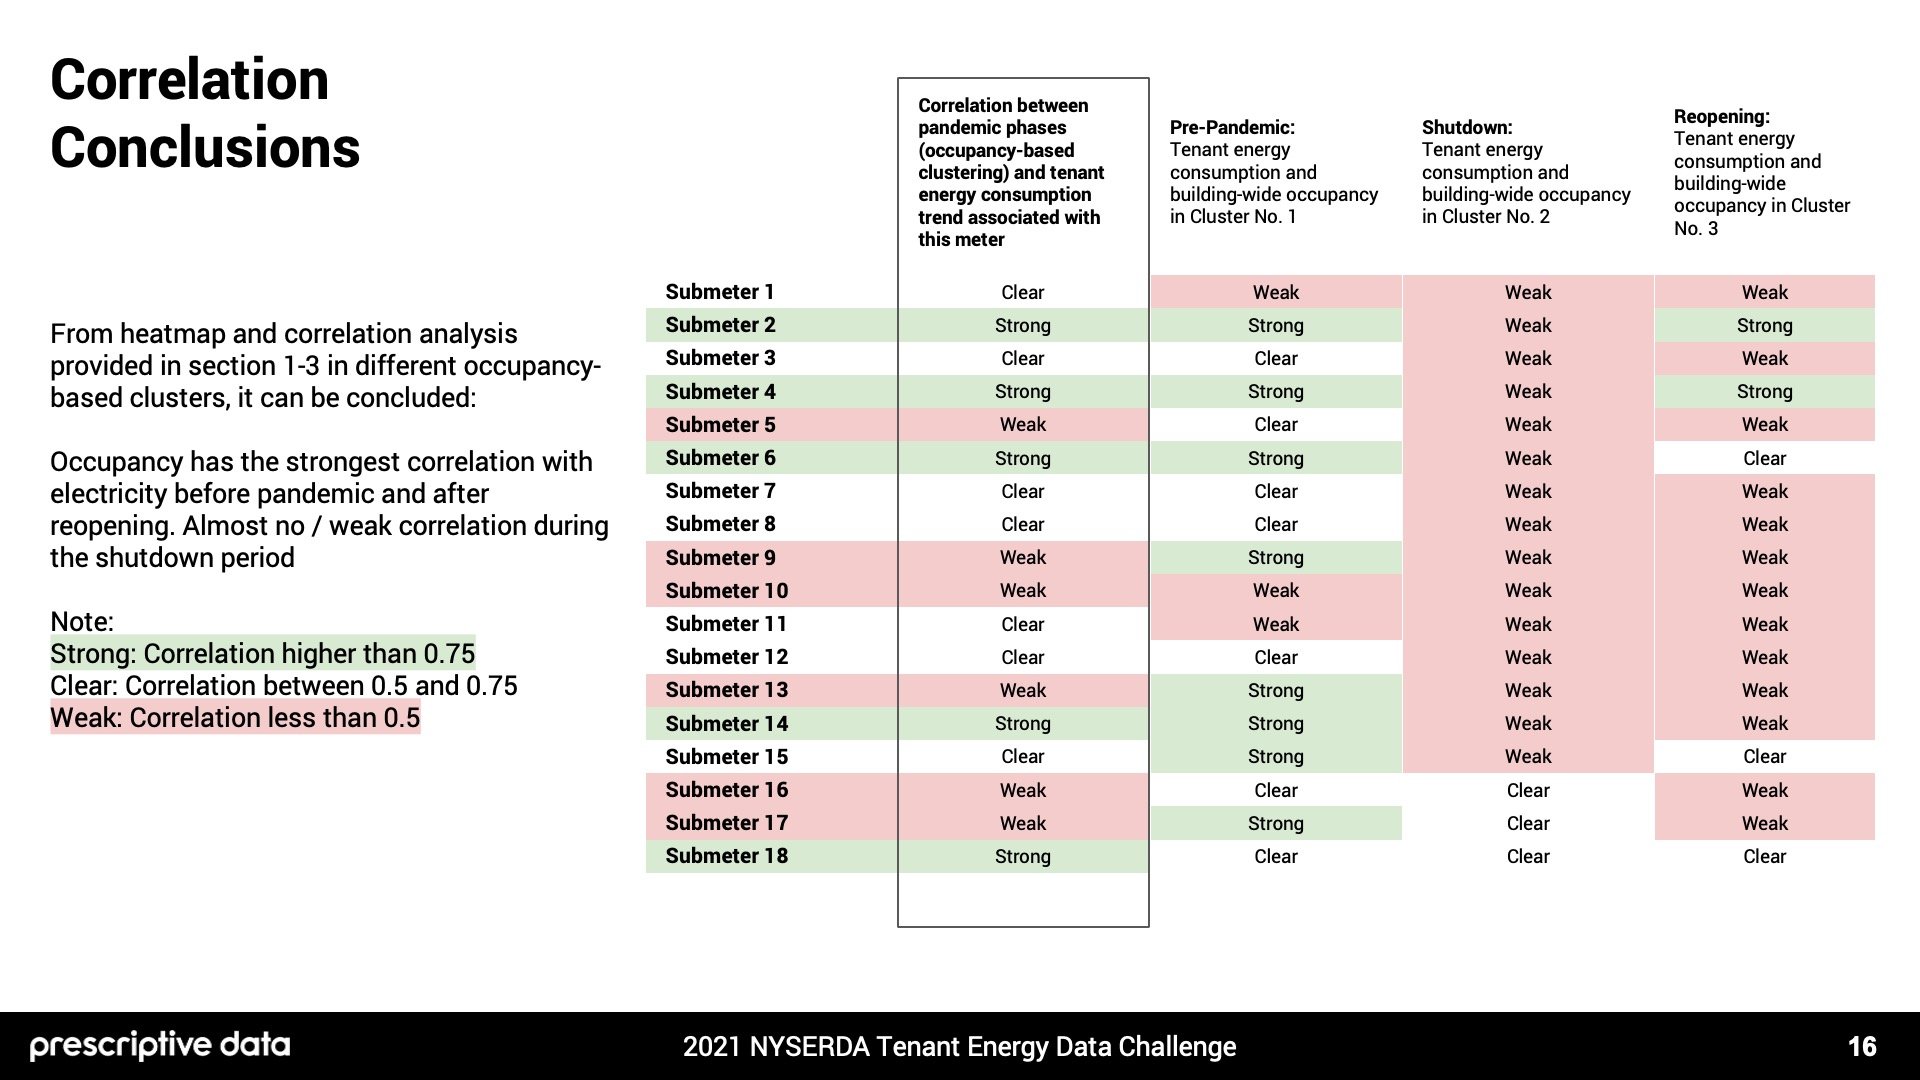
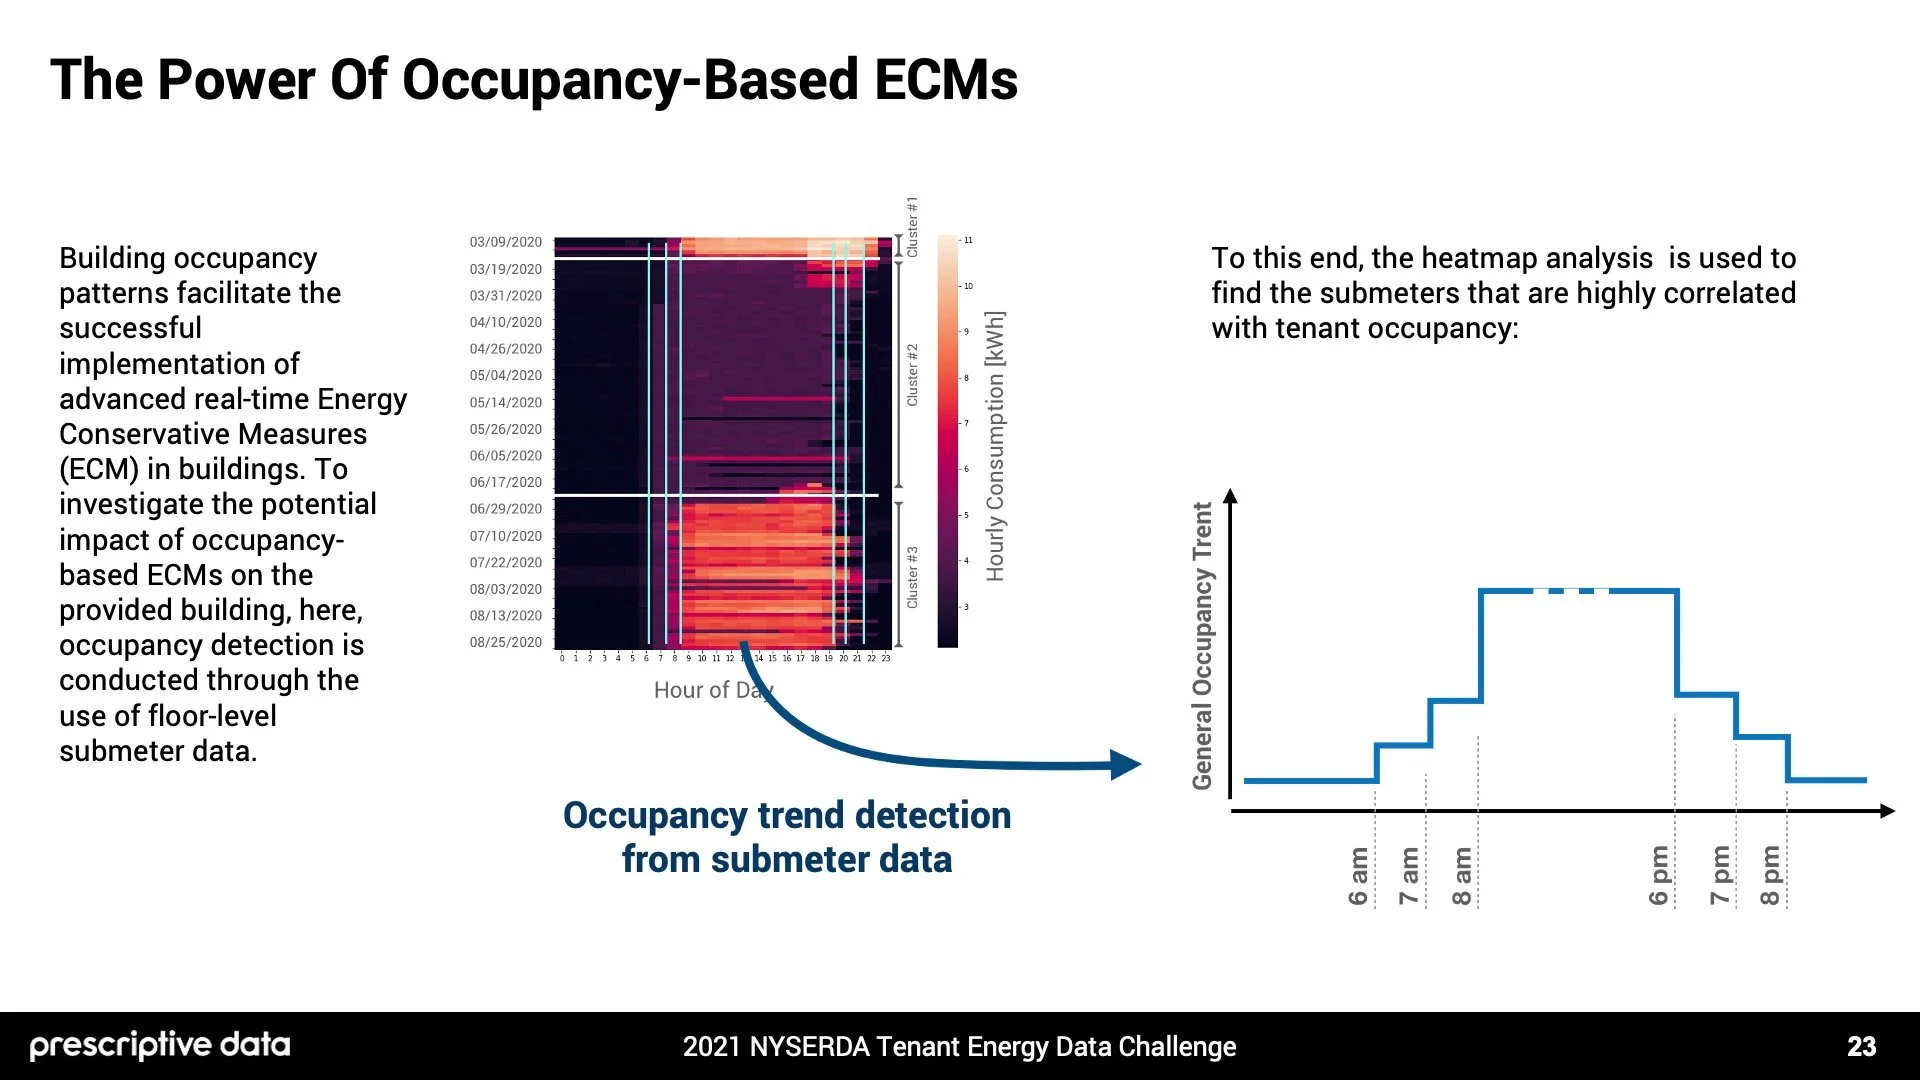
To understand the correlations between building occupancy and tend consumption, occupancy data is clustered based on occupancy level and date using expectation maximization algorithm into three groups. Interestingly, the clusters follow the real-world behavior and represent the three phases that are already observed in New York including: pre-pandemic period, shutdown period and reopening period.
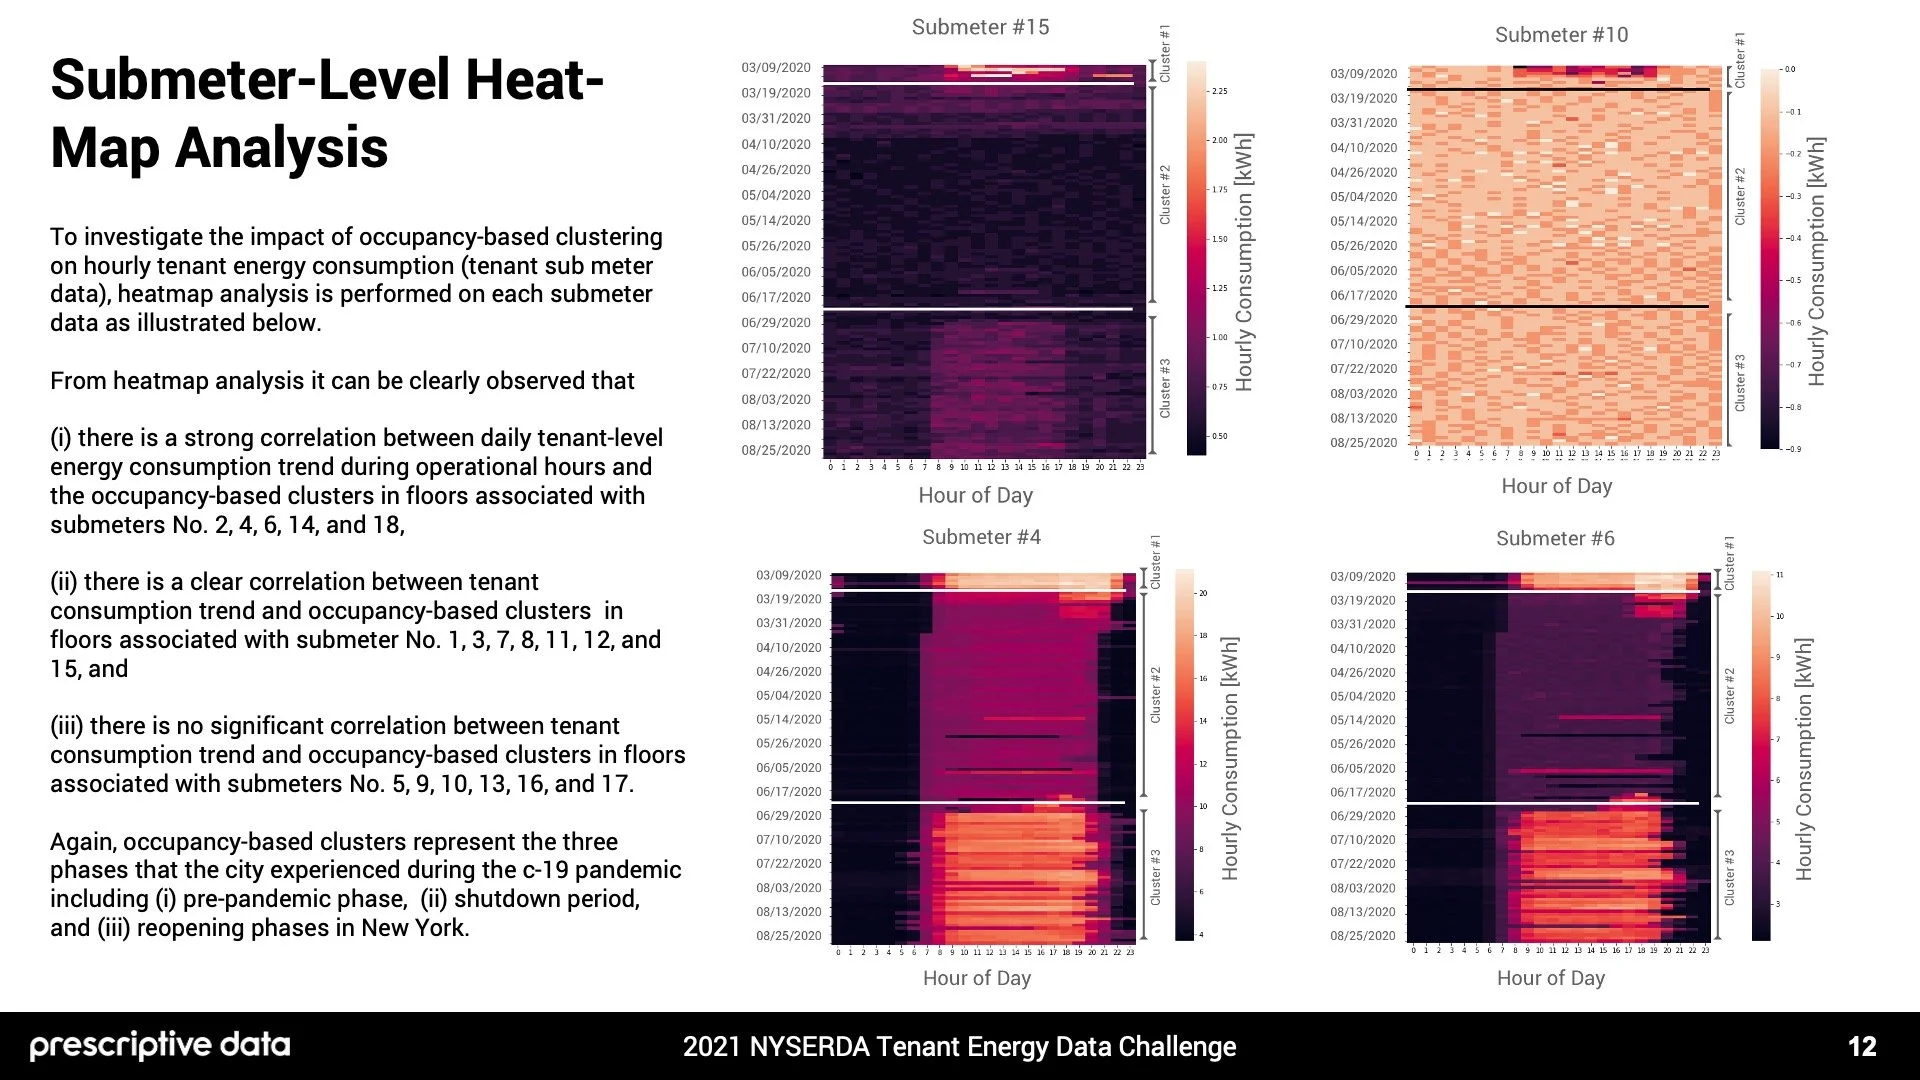
Heatmap analysis is performed on each submeter and from which it can be observed that there is a strong correlation between daily tenant-level energy consumption trend during operational hours and the occupancy-based clusters for submeters No. 2, 4, 6, 14, and 18; a clear correlation for submeter No. 1, 3, 7, 8, 11, 12, and 15, and there is no significant correlation for submeters No. 5, 9, 10, 13, 16, and 17.
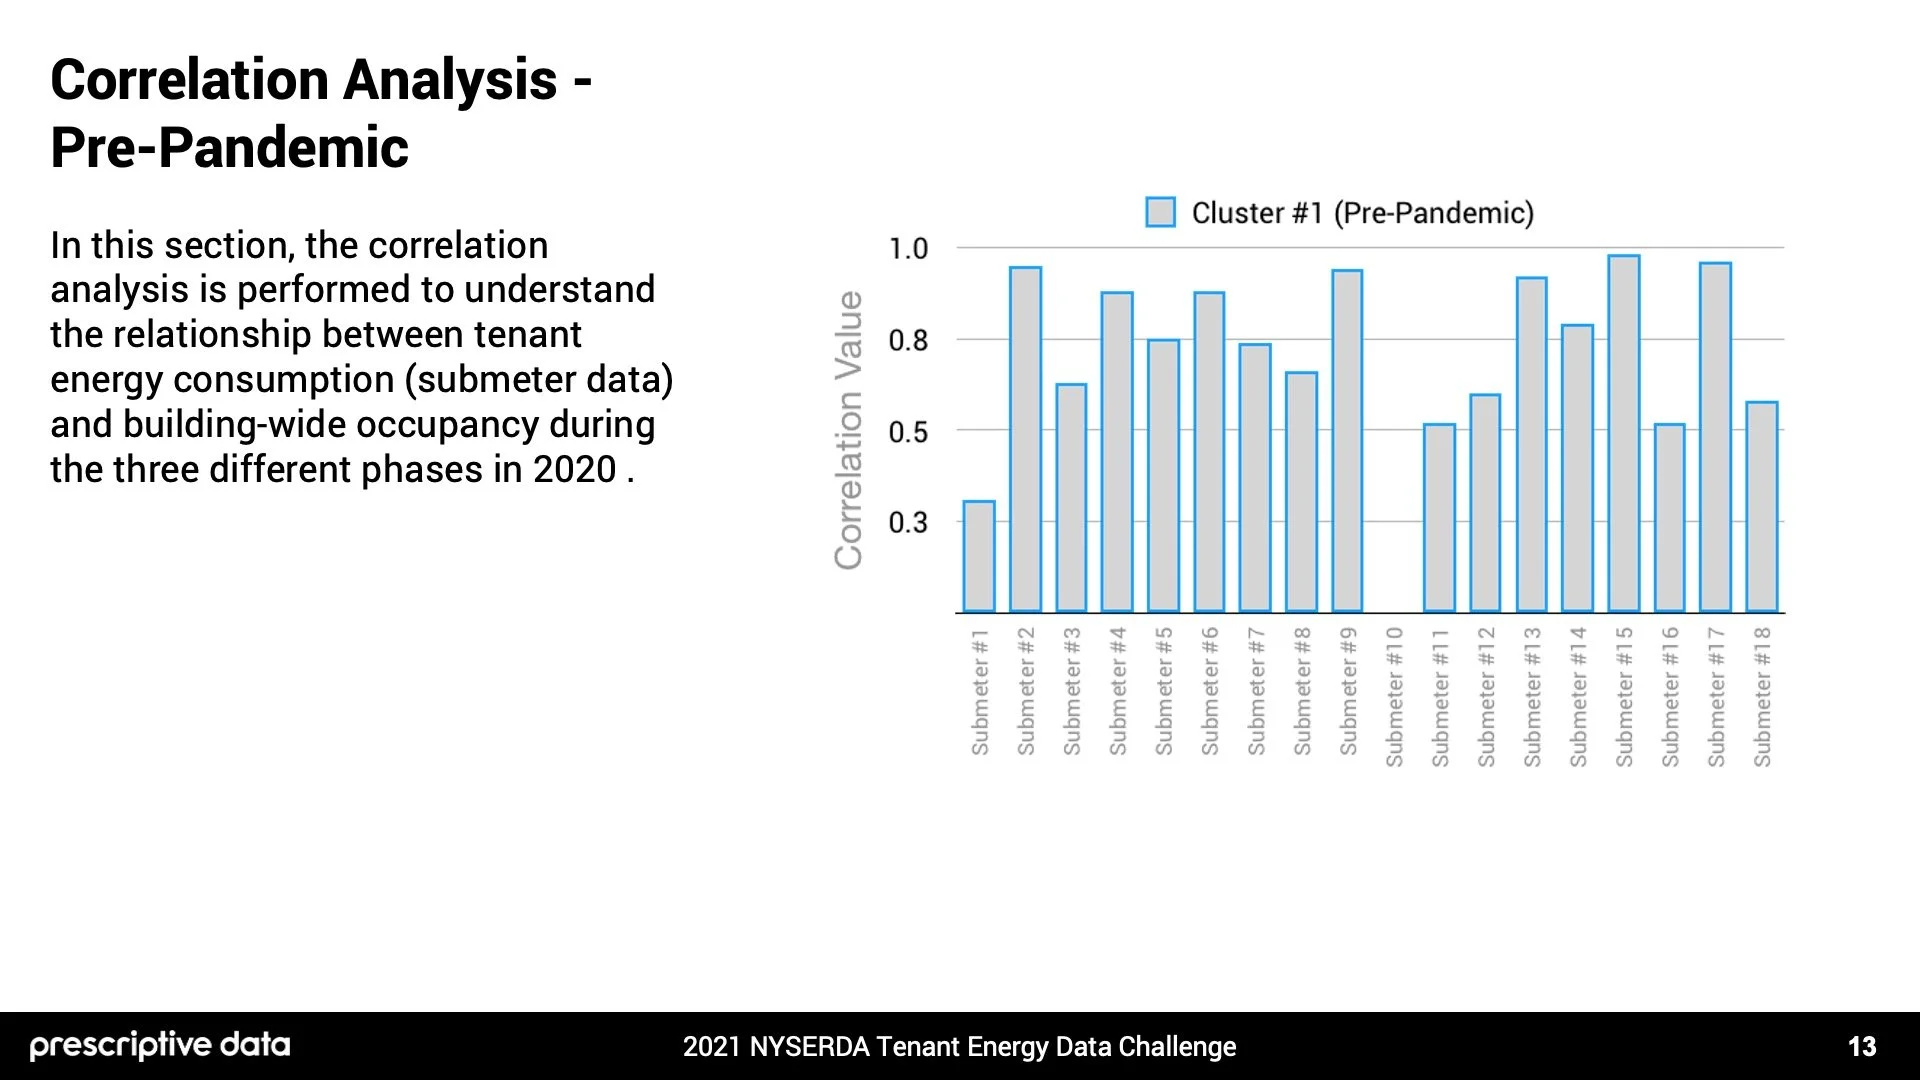
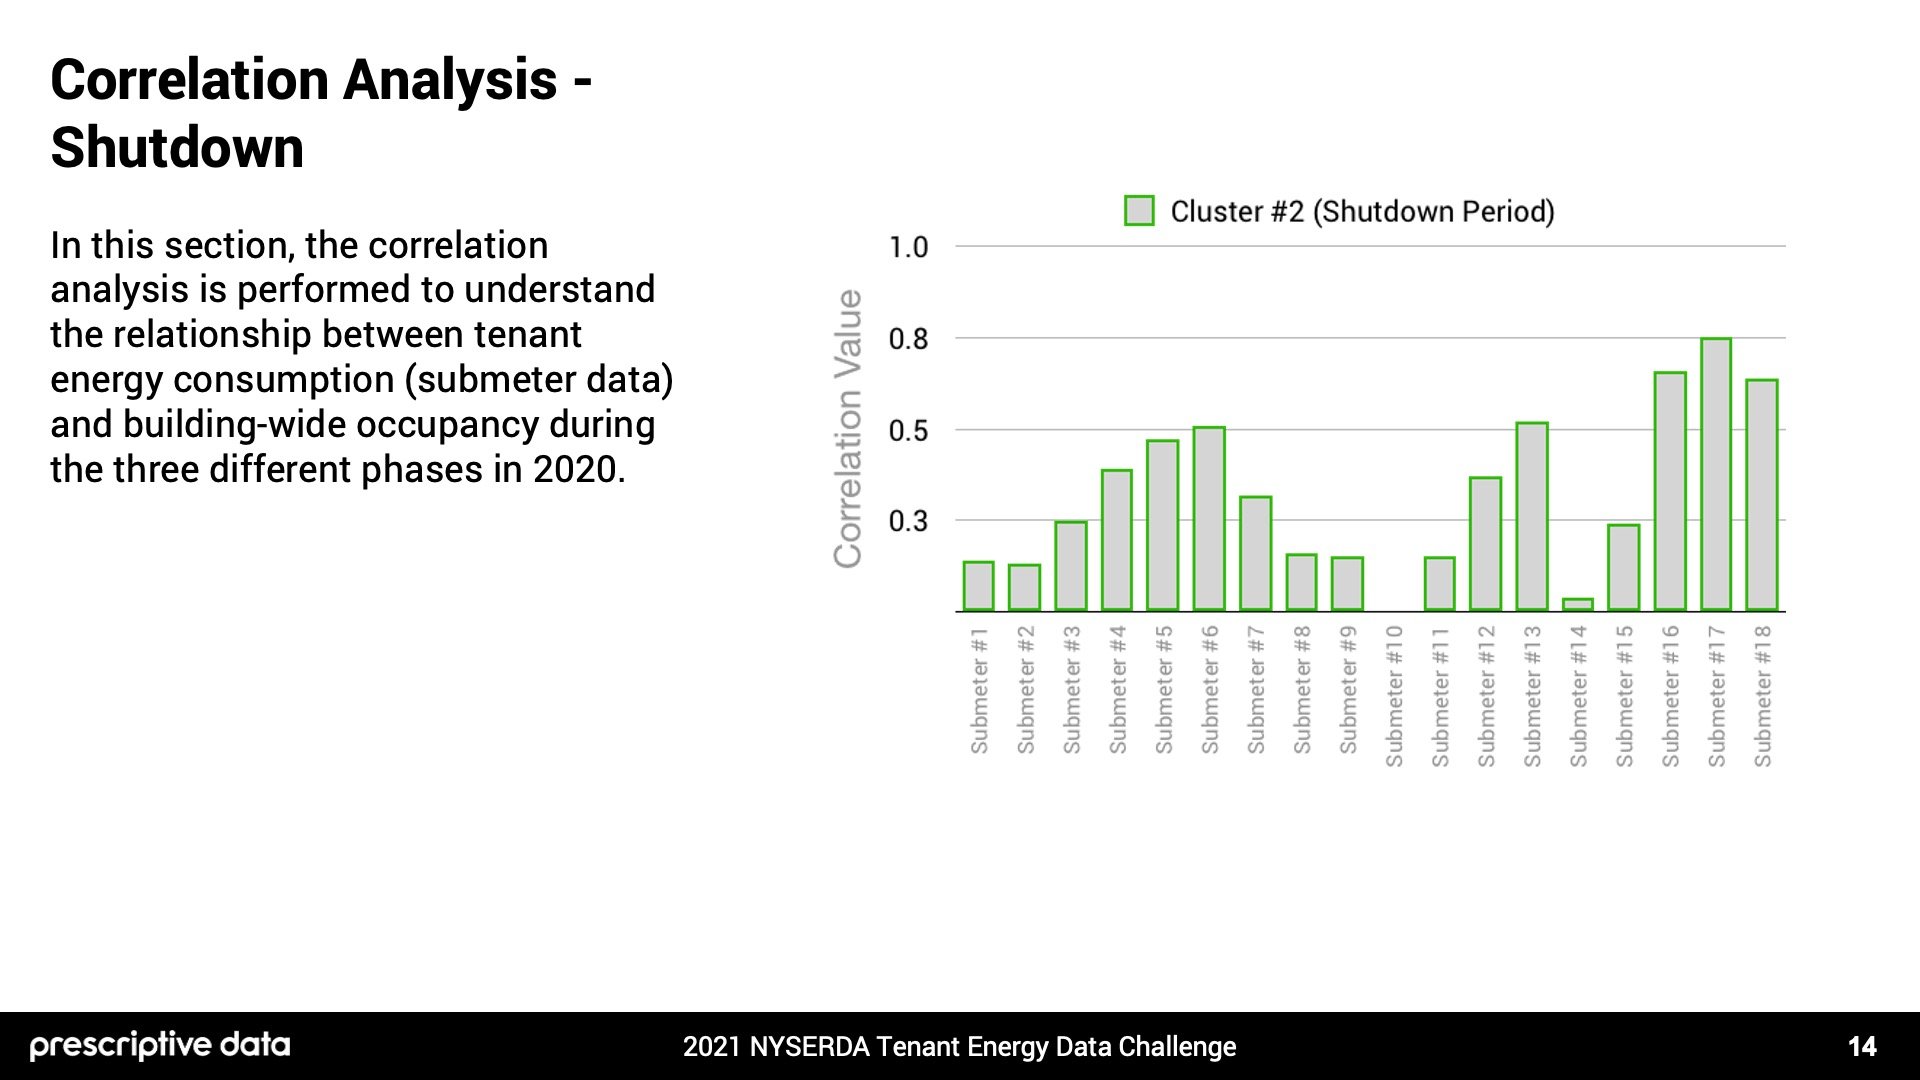
Specifically, during each cluster period, building-wide occupancy is most correlated with tenant consumptions in cluster 1 of pre-pandemic period, while during shutdown and reopening of clusters 2 and 3, the correlation is much lower.
Question 3 of 7
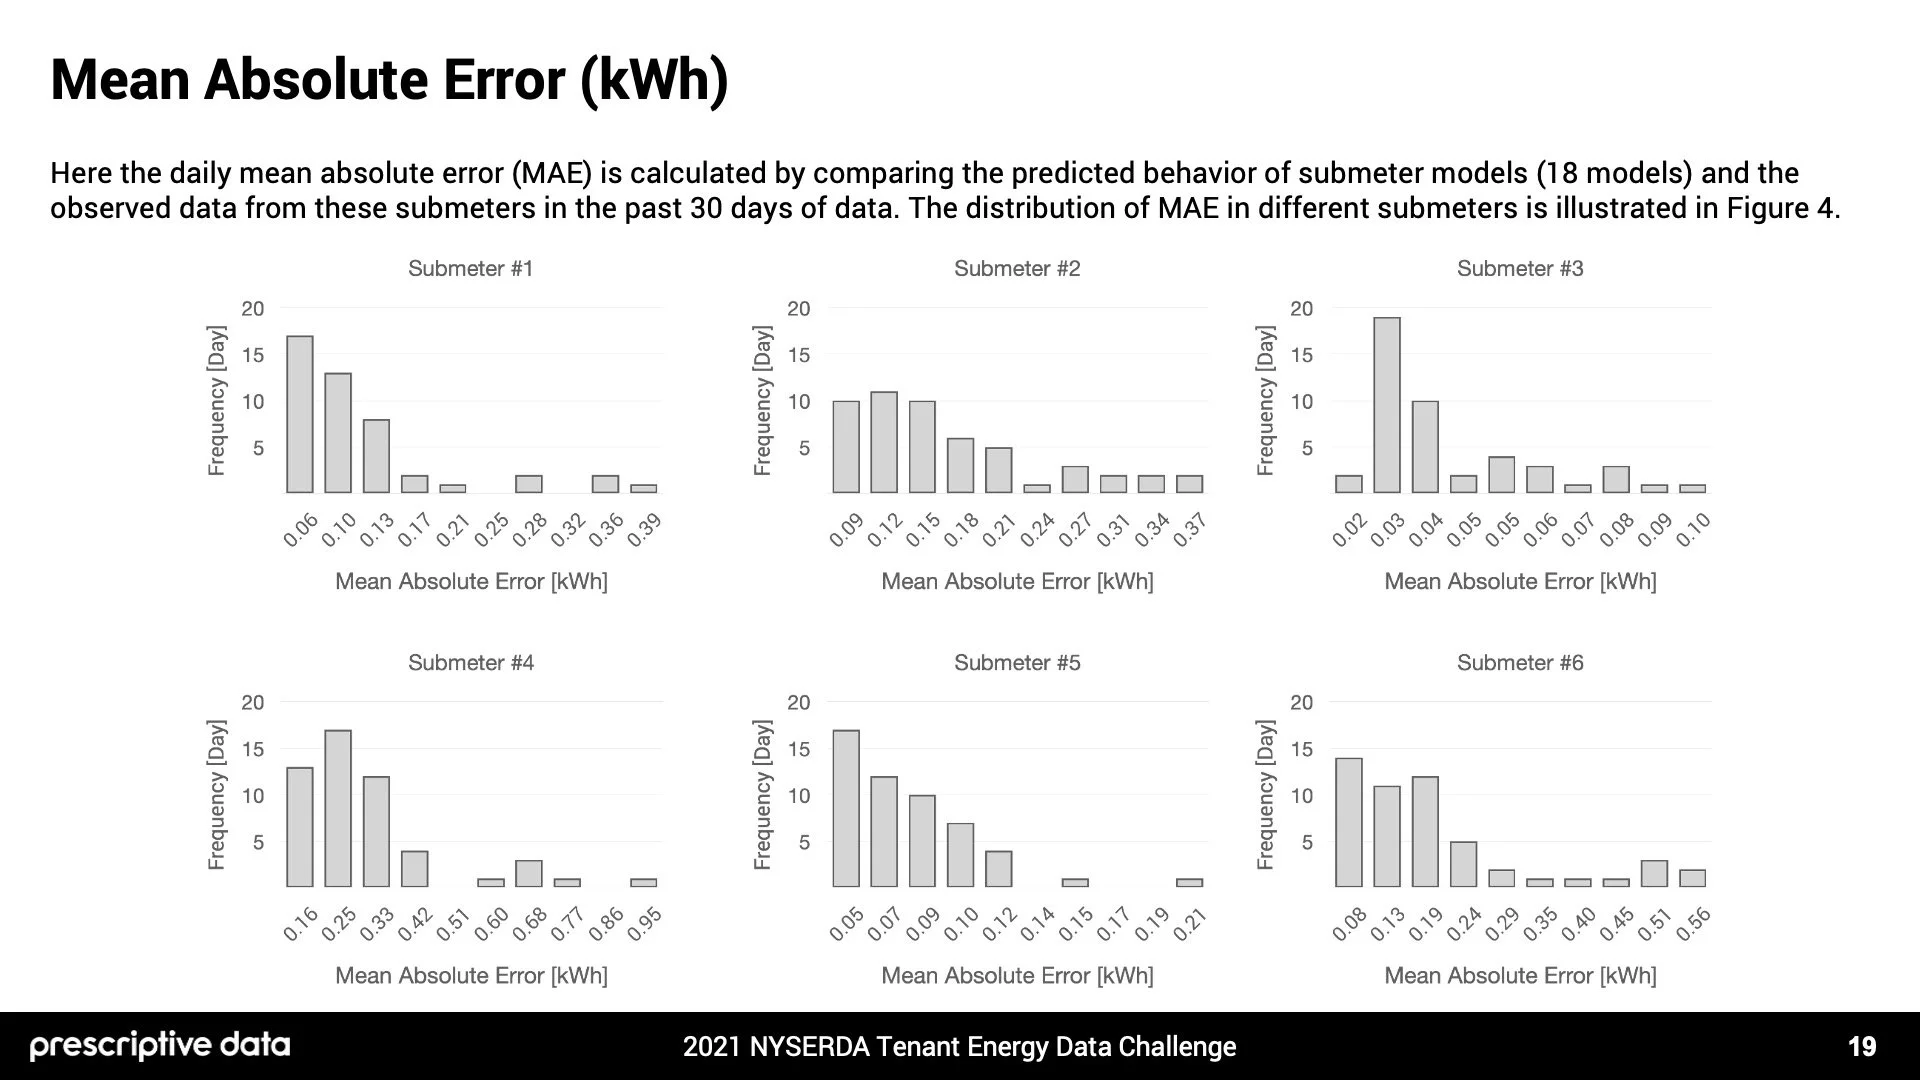
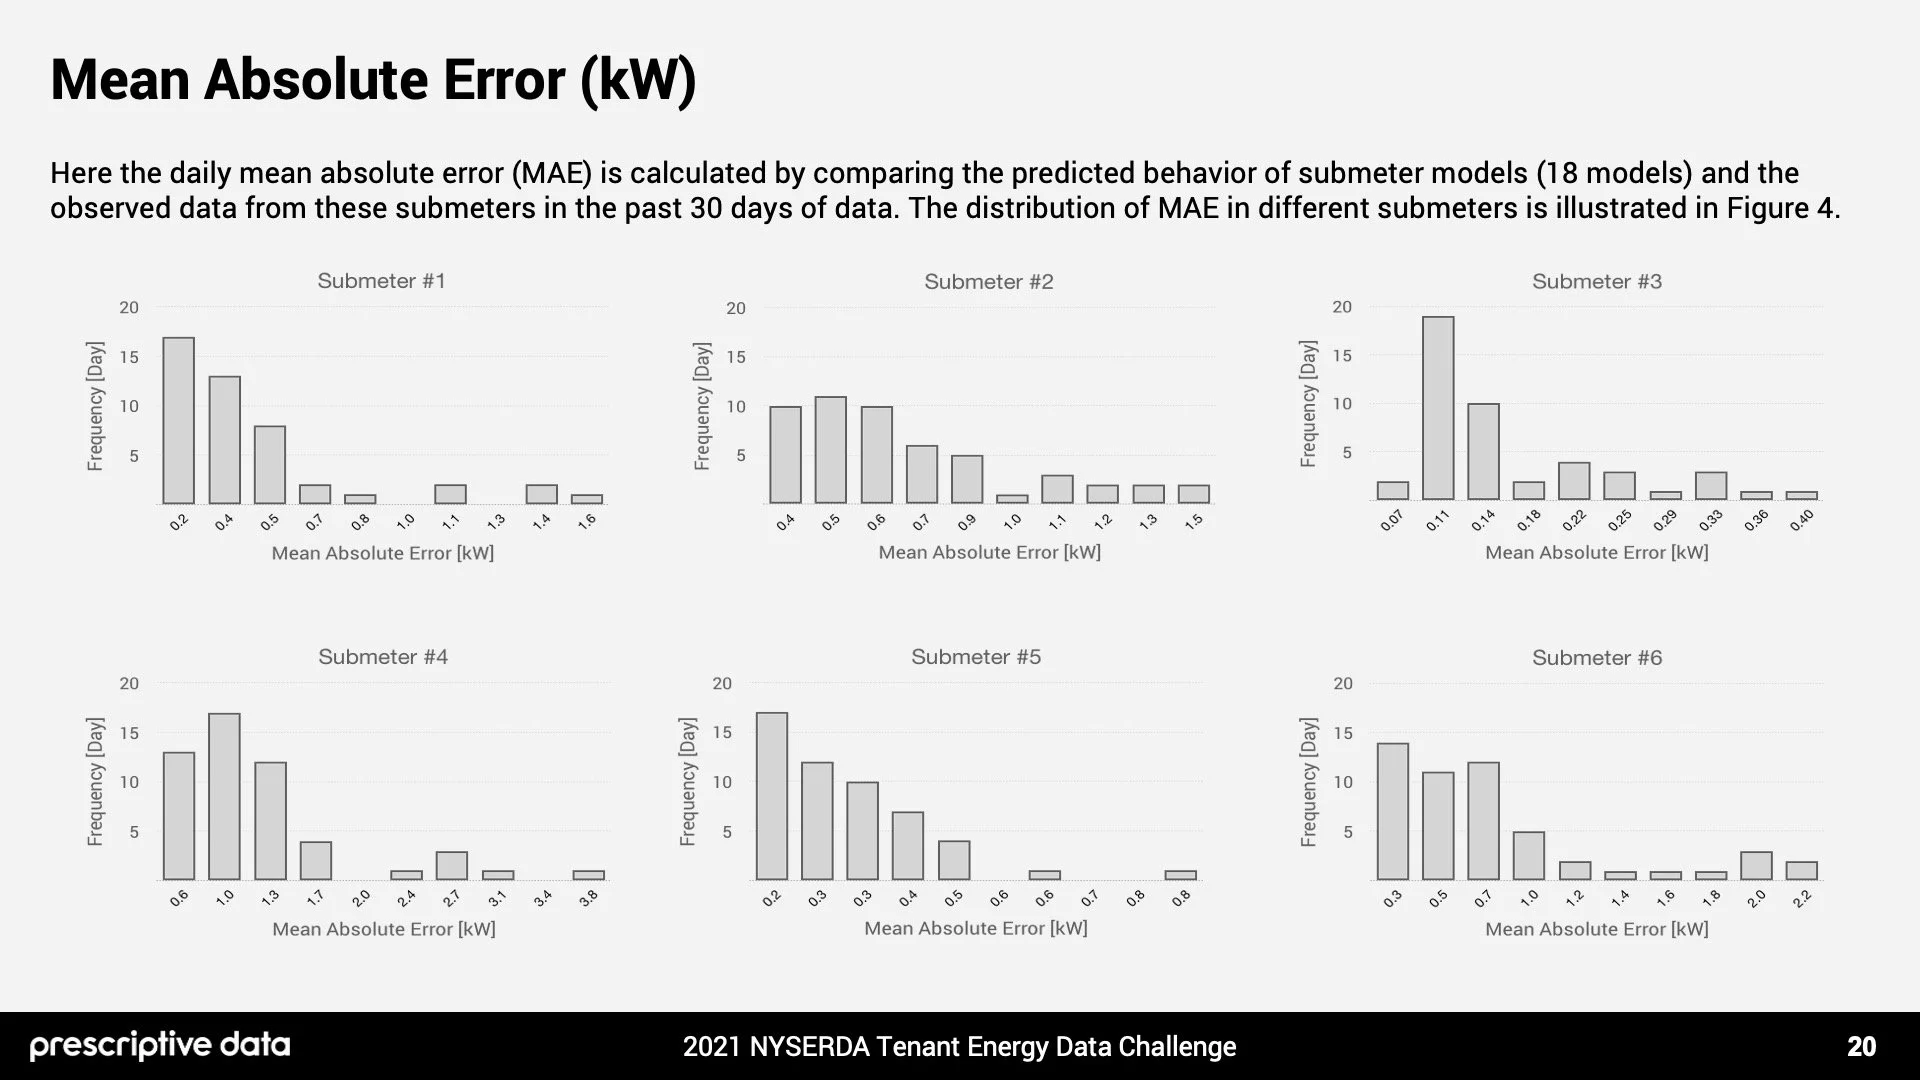
What is the mean absolute error for your model?
(CLICK THE LEFT AND RIGHT ARROWS BELOW TO VIEW PRESENTATION SECTION)
Download: Full Presentation (PDF)
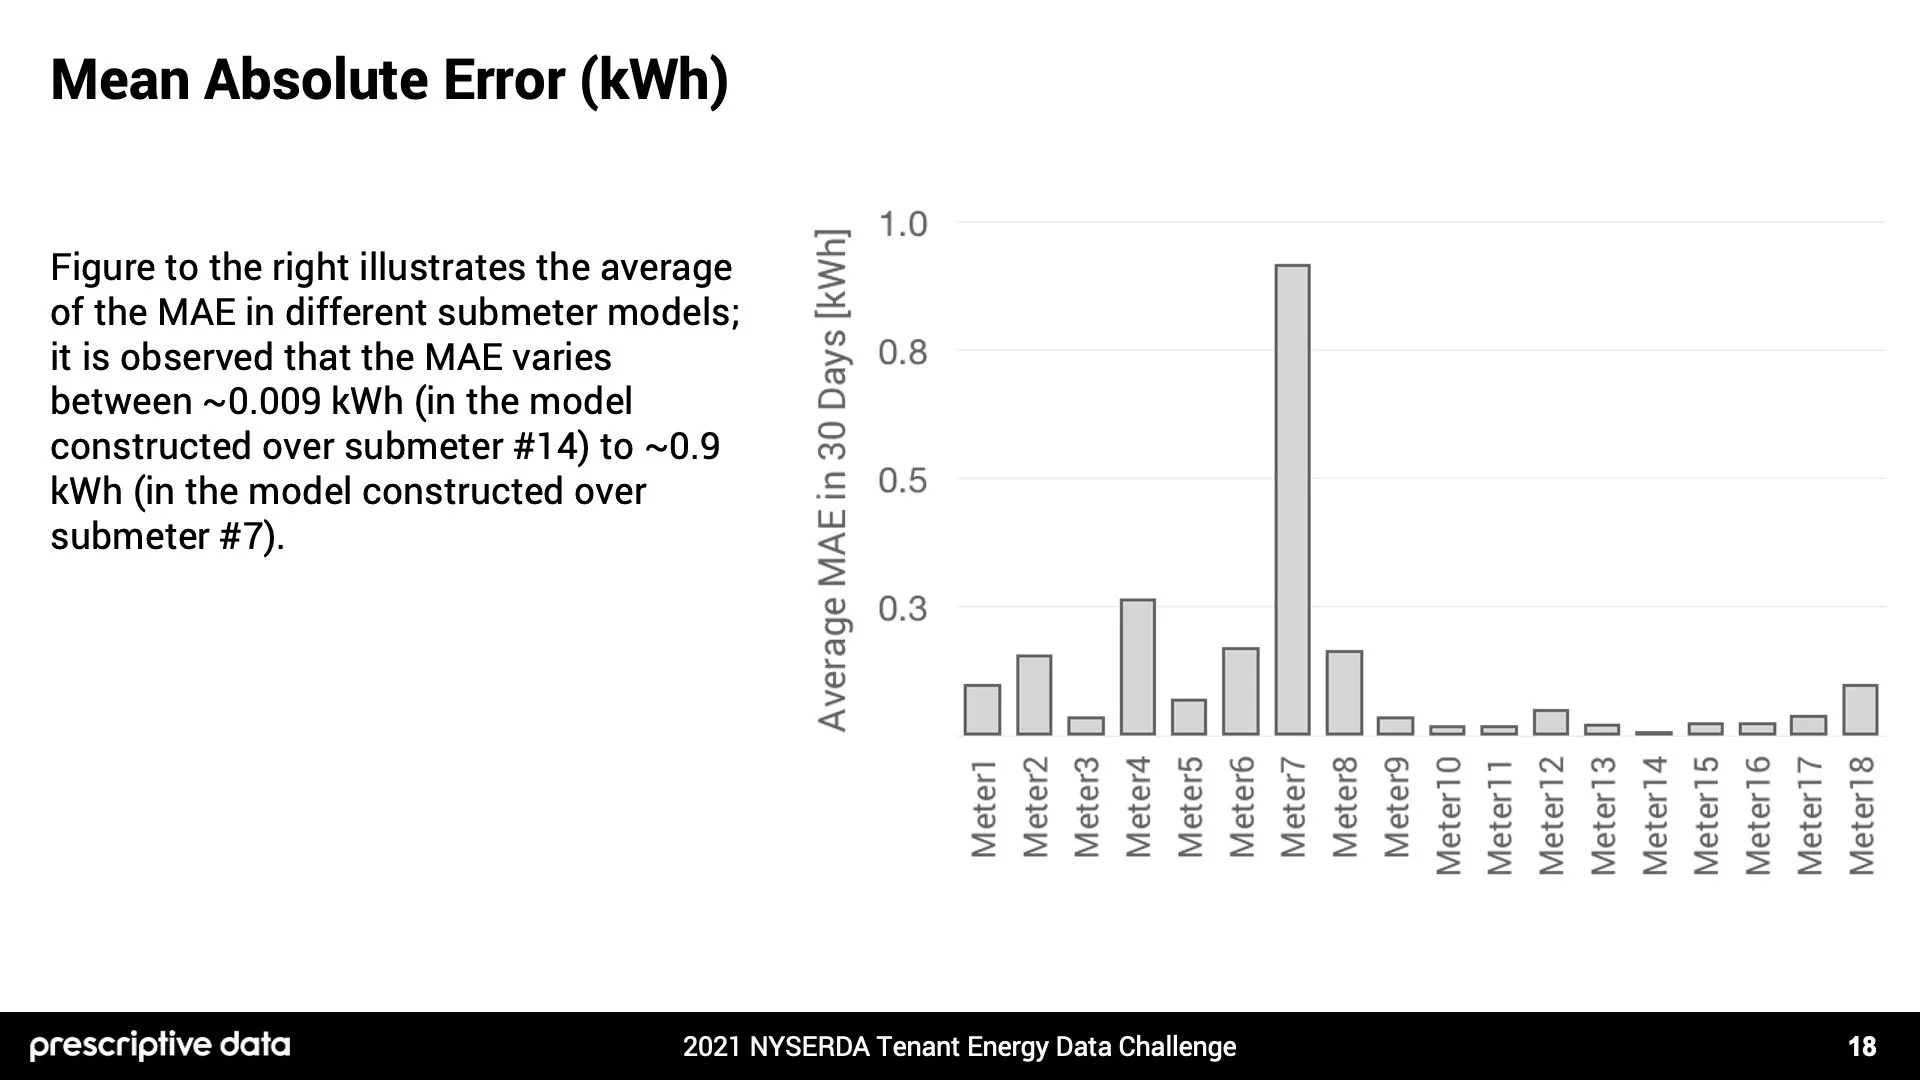
For Kilowatt Hours, it is observed that the MAE varies between ~0.009 kWh (in the model constructed over submeter #14) to ~0.9 kWh (in the model constructed over submeter #7).
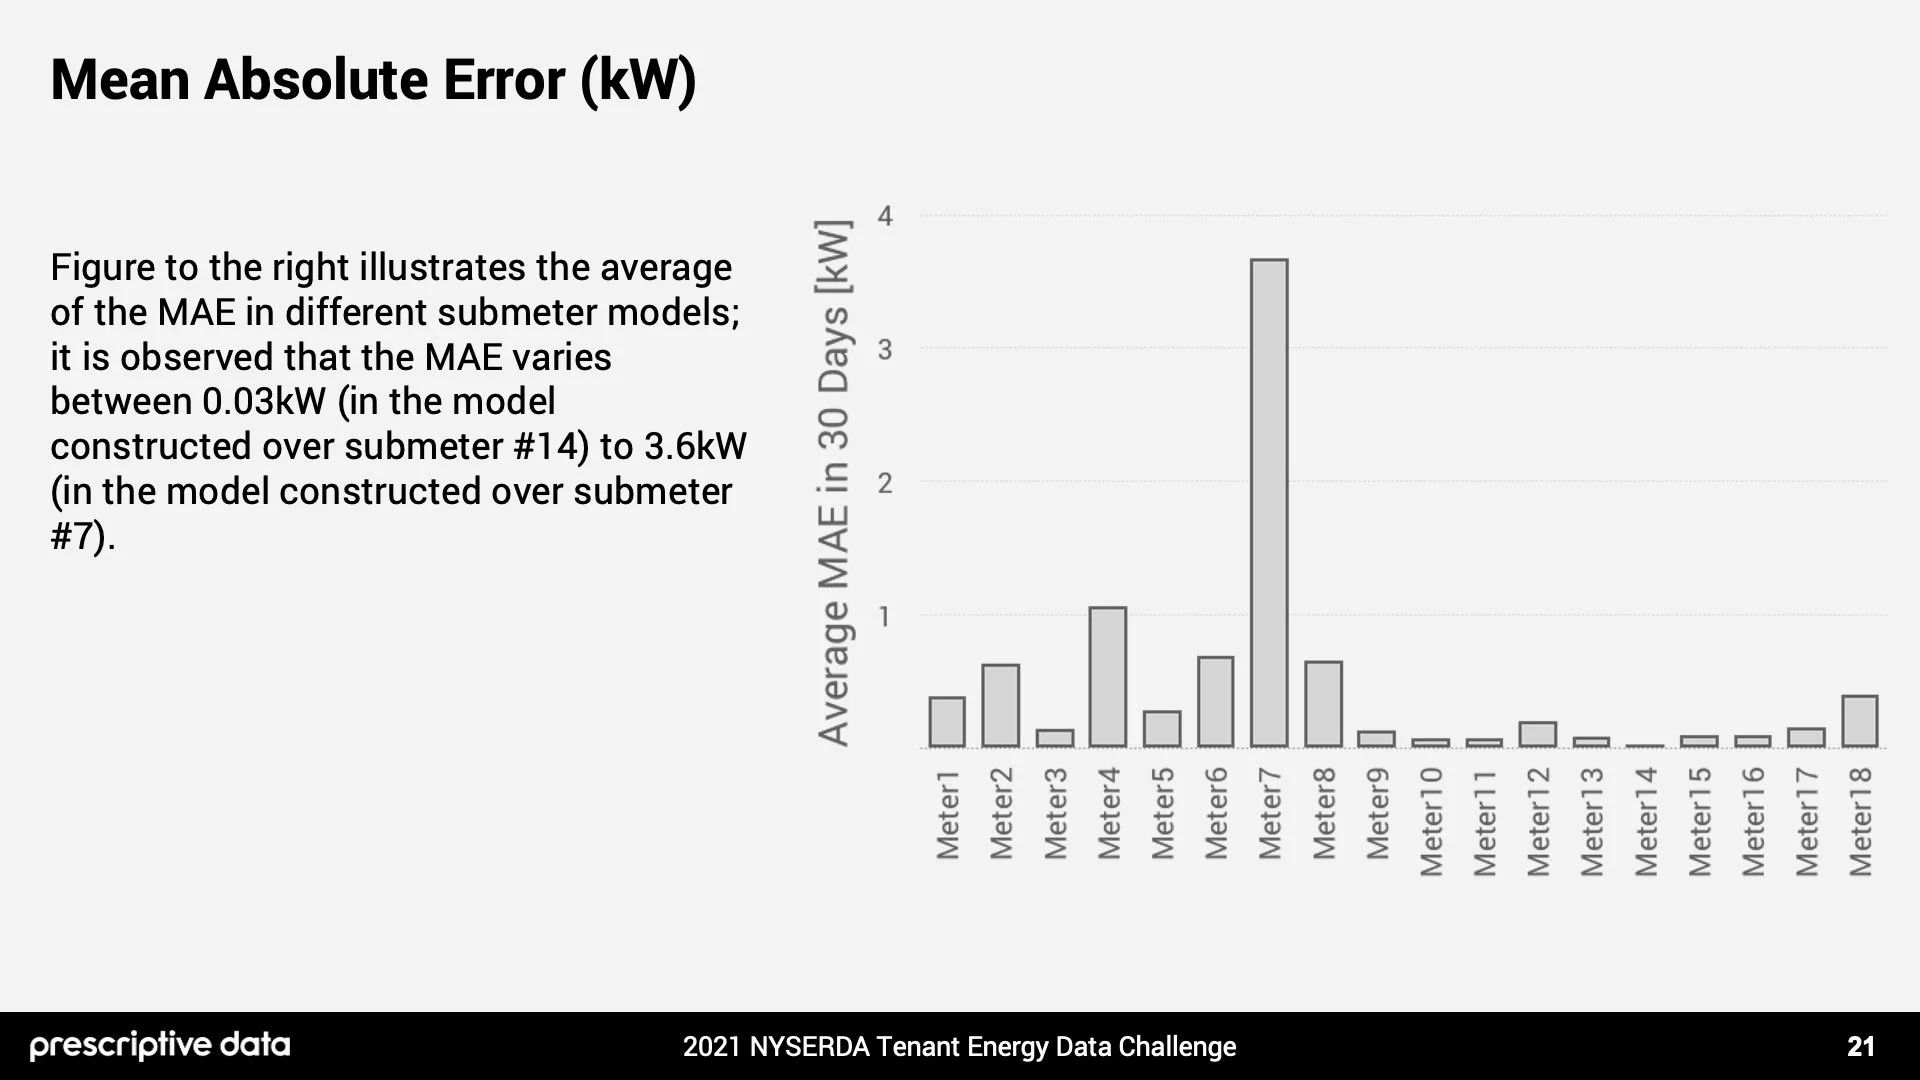
For Kilowatts, the mean absolute error for each submeter has an average of 0.5kW and ranges from 0.03kW for meter No.14 to 3.673kW for meter No.7.
Question 4 of 7
What features / predictors were most important in determining energy efficiency?
(CLICK THE LEFT AND RIGHT ARROWS BELOW TO VIEW PRESENTATION SECTION)
Download: Full Presentation (PDF)
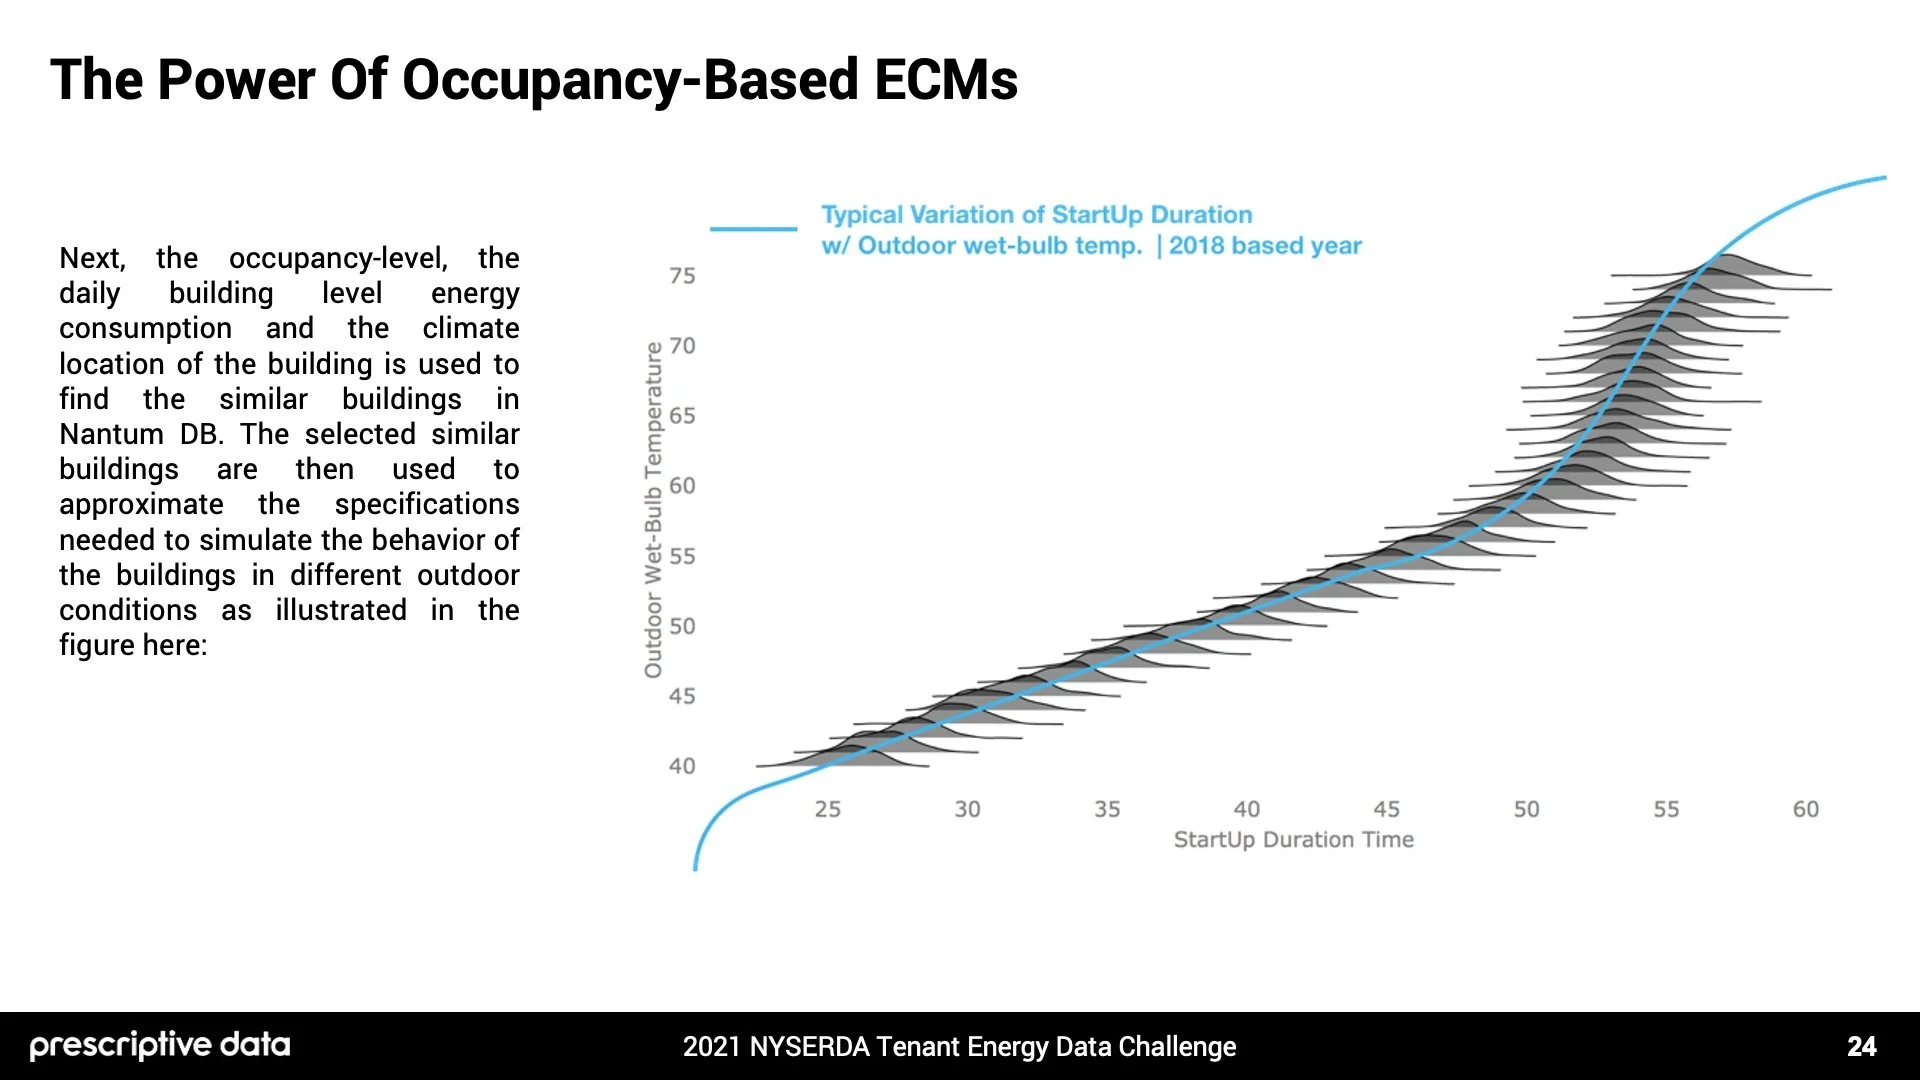
Building occupancy and occupancy patterns are most in determining energy efficiency and facilitating the successful implementation of advanced real-time Energy Conservative Measures (ECM) in buildings. To investigate the potential impact of occupancy-based ECMs on the provided building, occupancy detection is conducted through the use of floor-level submeter data. Next, the occupancy-level, the daily building level energy consumption and the climate location of the building is used to find the similar buildings in Nantum OS database.
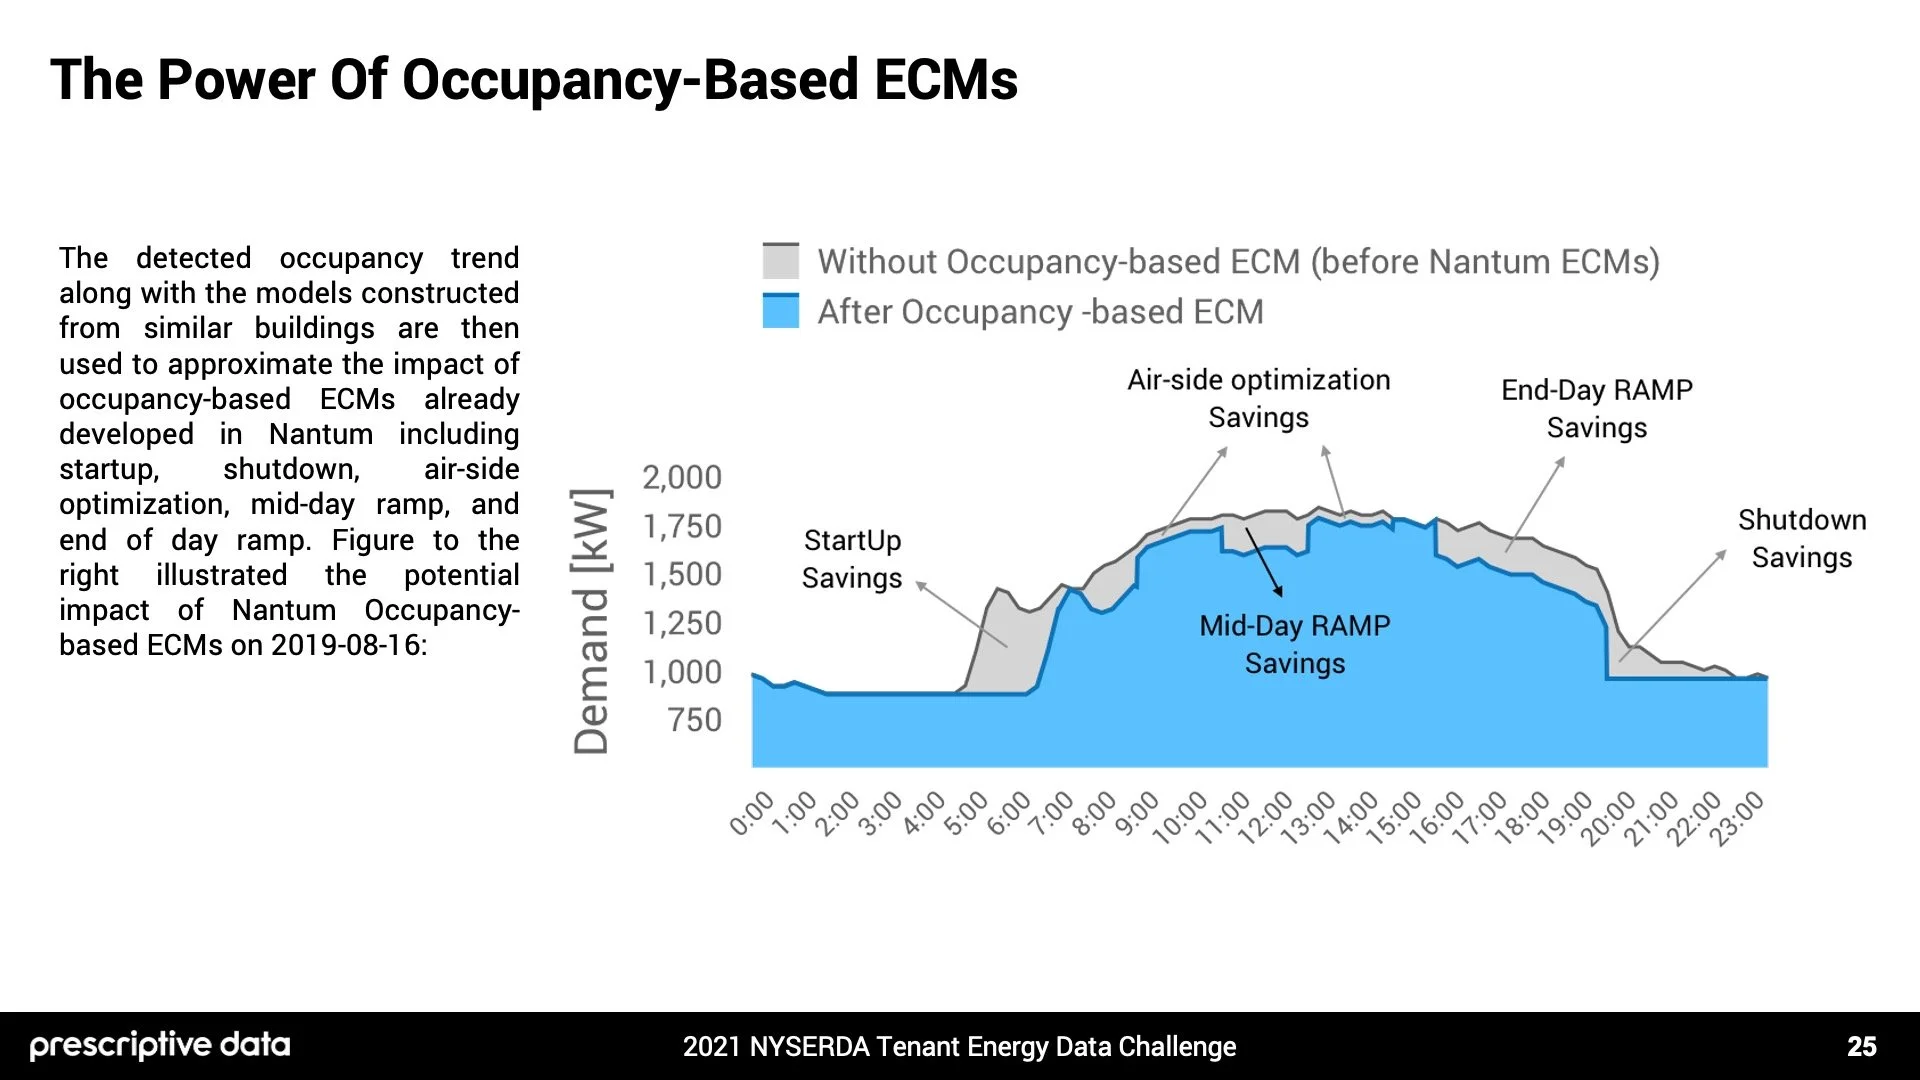
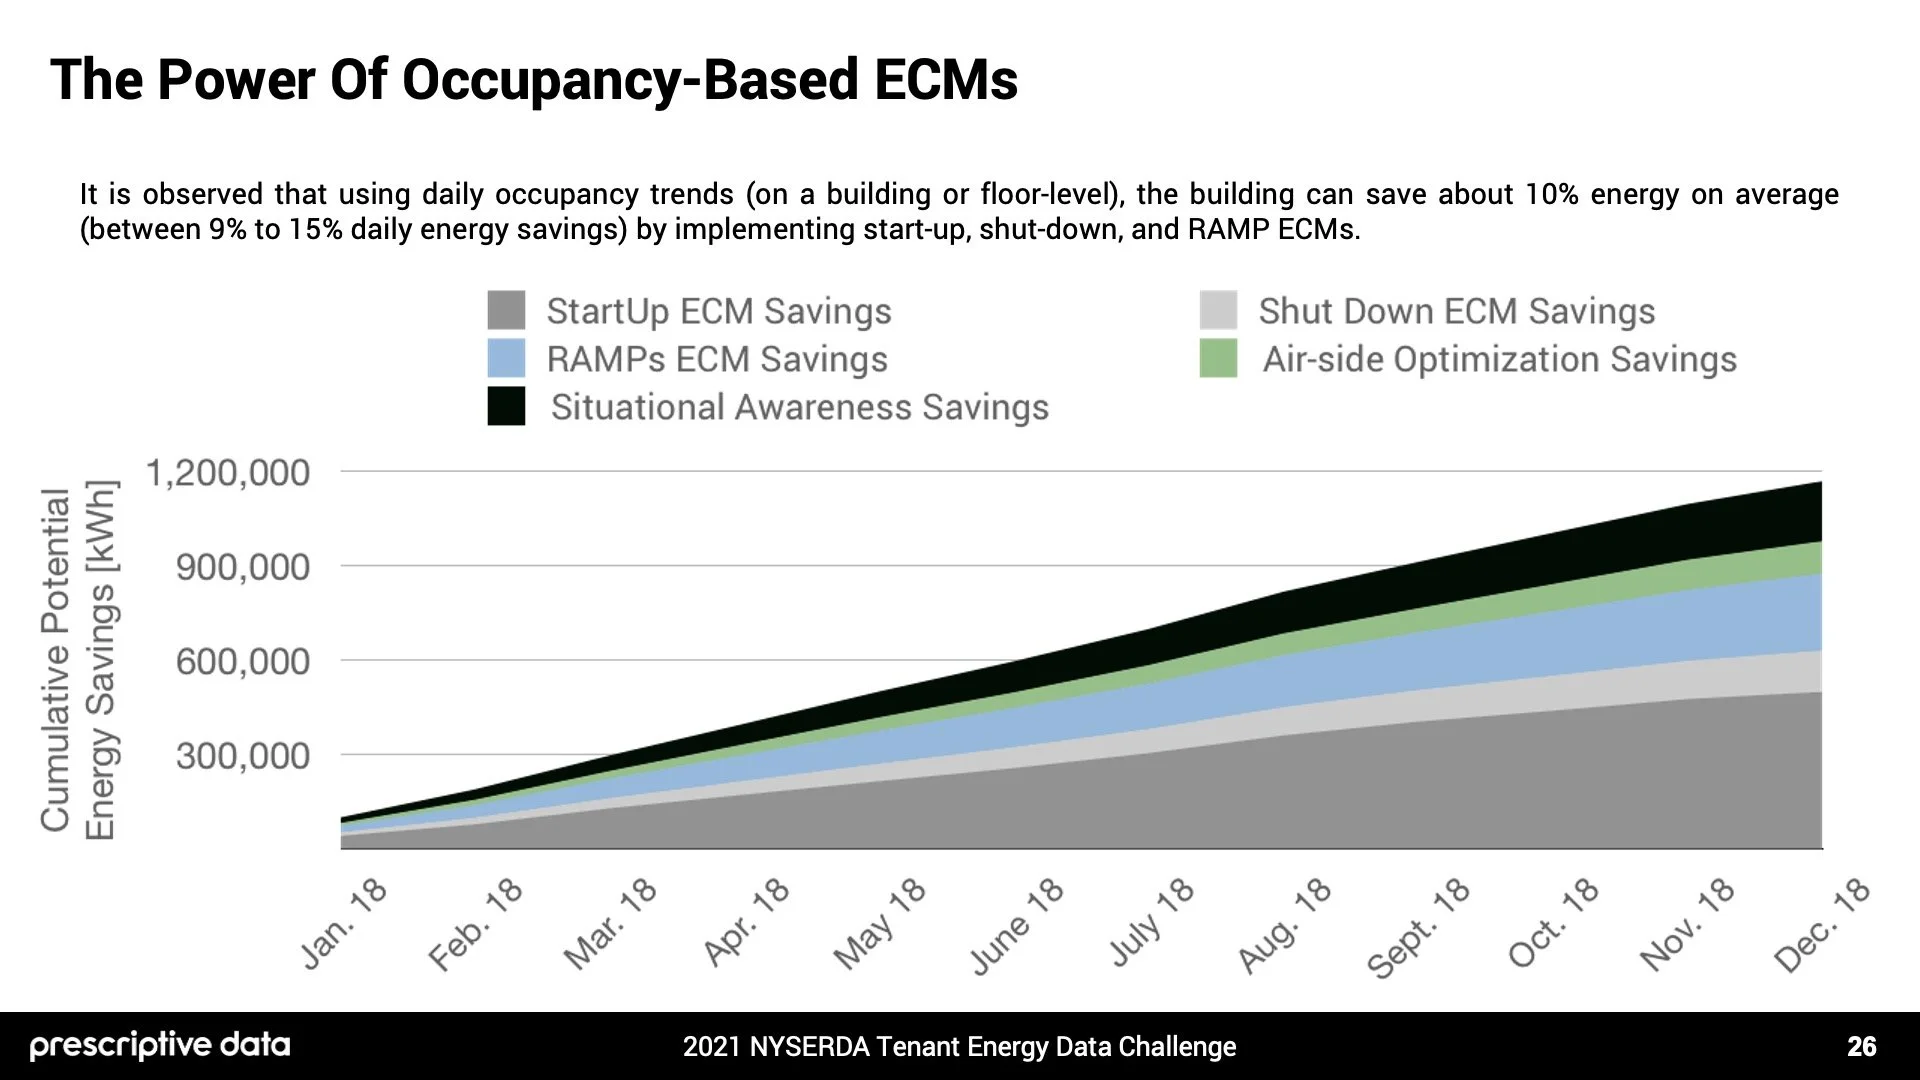
The selected similar buildings are then used to approximate the specifications needed to simulate the behavior of the buildings in different outdoor conditions. The detected occupancy trend along with the models constructed from similar buildings are then used to approximate the impact of occupancy-based ECMs already developed in Nantum including startup, shutdown, air-side optimization, mid-day ramp, and end of day ramp. It is estimated that the building can save about 10% energy on average (between 9% to 15% daily energy savings) by implementing these ECMs.
Question 5 of 7
What is the most energy-efficient occupancy level as a percentage of max occupancy provided? (i.e. Occupancy on 02/10/2020)
(CLICK THE LEFT AND RIGHT ARROWS BELOW TO VIEW PRESENTATION SECTION)
Download: Full Presentation (PDF)
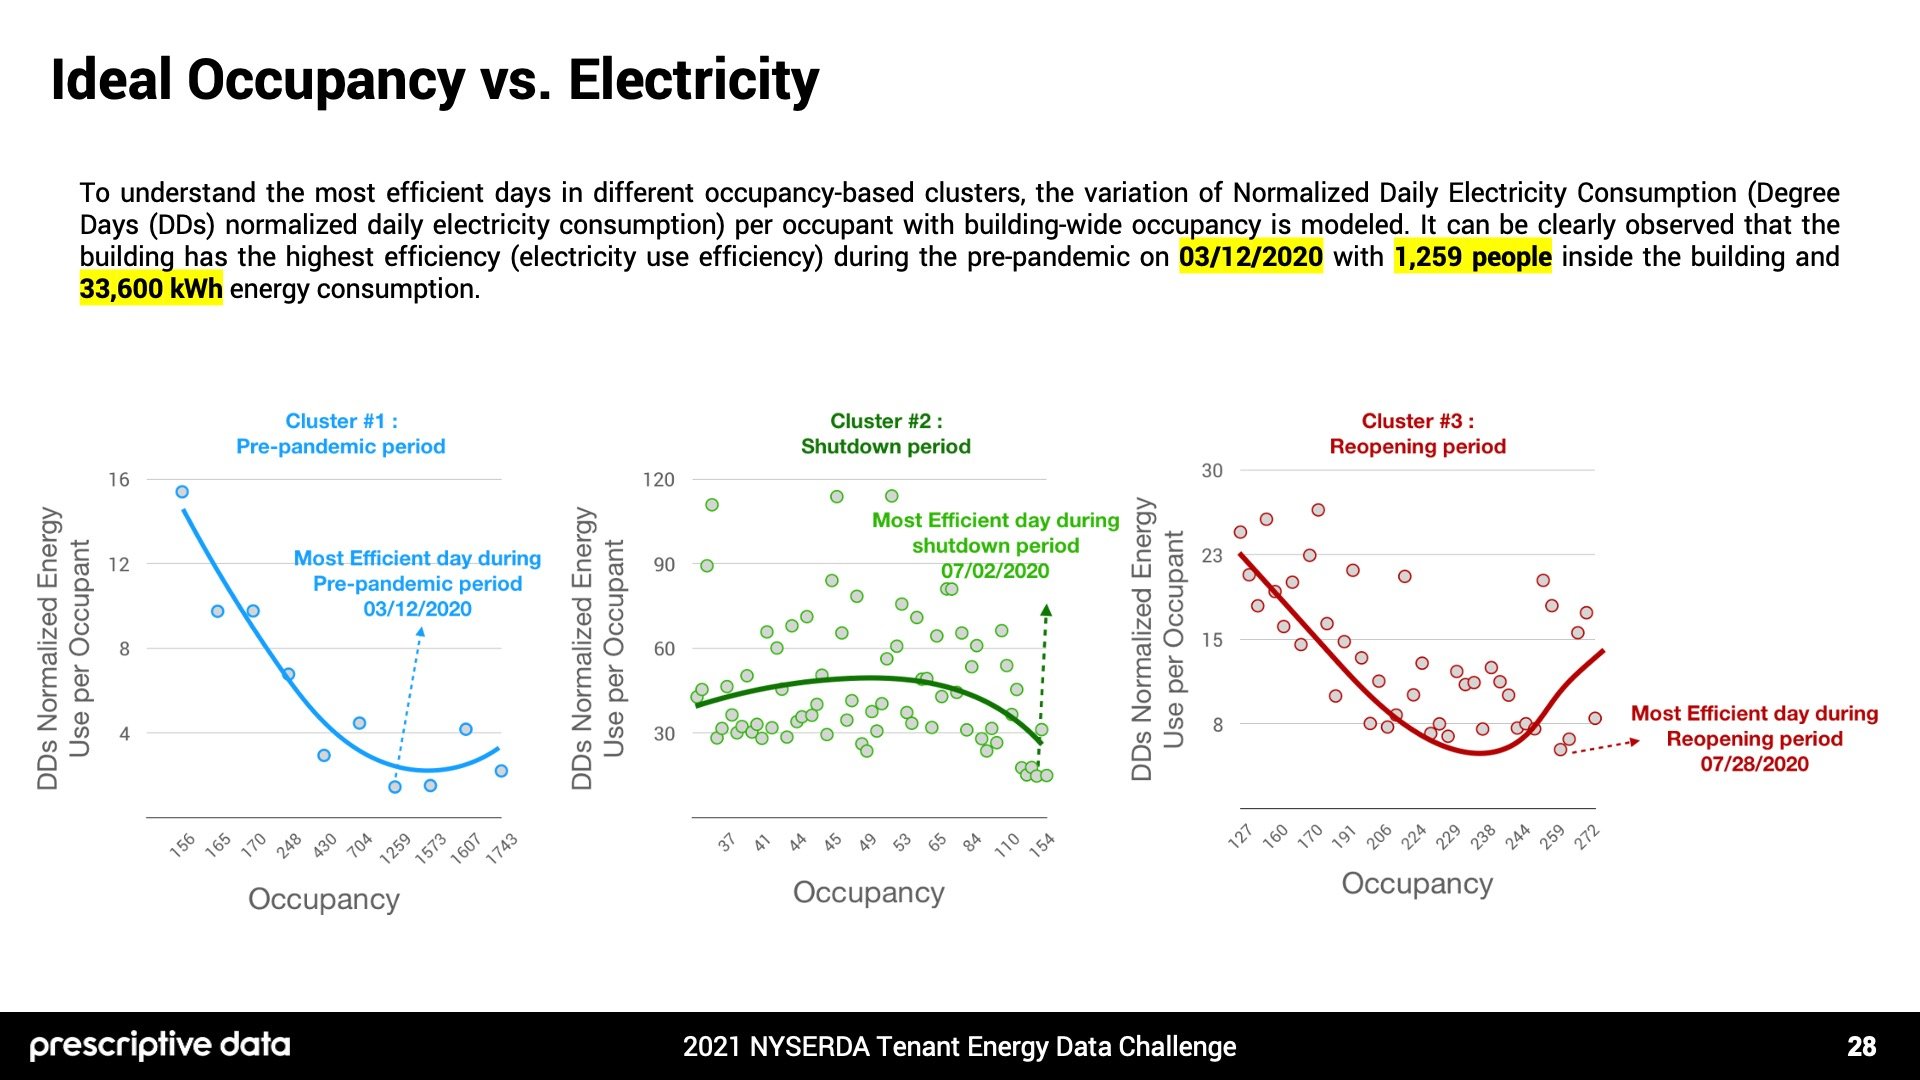
To understand the most efficient days in different occupancy-based clusters, the variation of Normalized Daily Electricity Consumption (Degree Days (DDs) normalized daily electricity consumption) per occupant with building-wide occupancy is modeled.
It can be clearly observed that the building has the highest efficiency (electricity use efficiency) during the pre-pandemic on 03/12/2020 with 1,259 people inside the building and 33,600 kWh energy consumption.
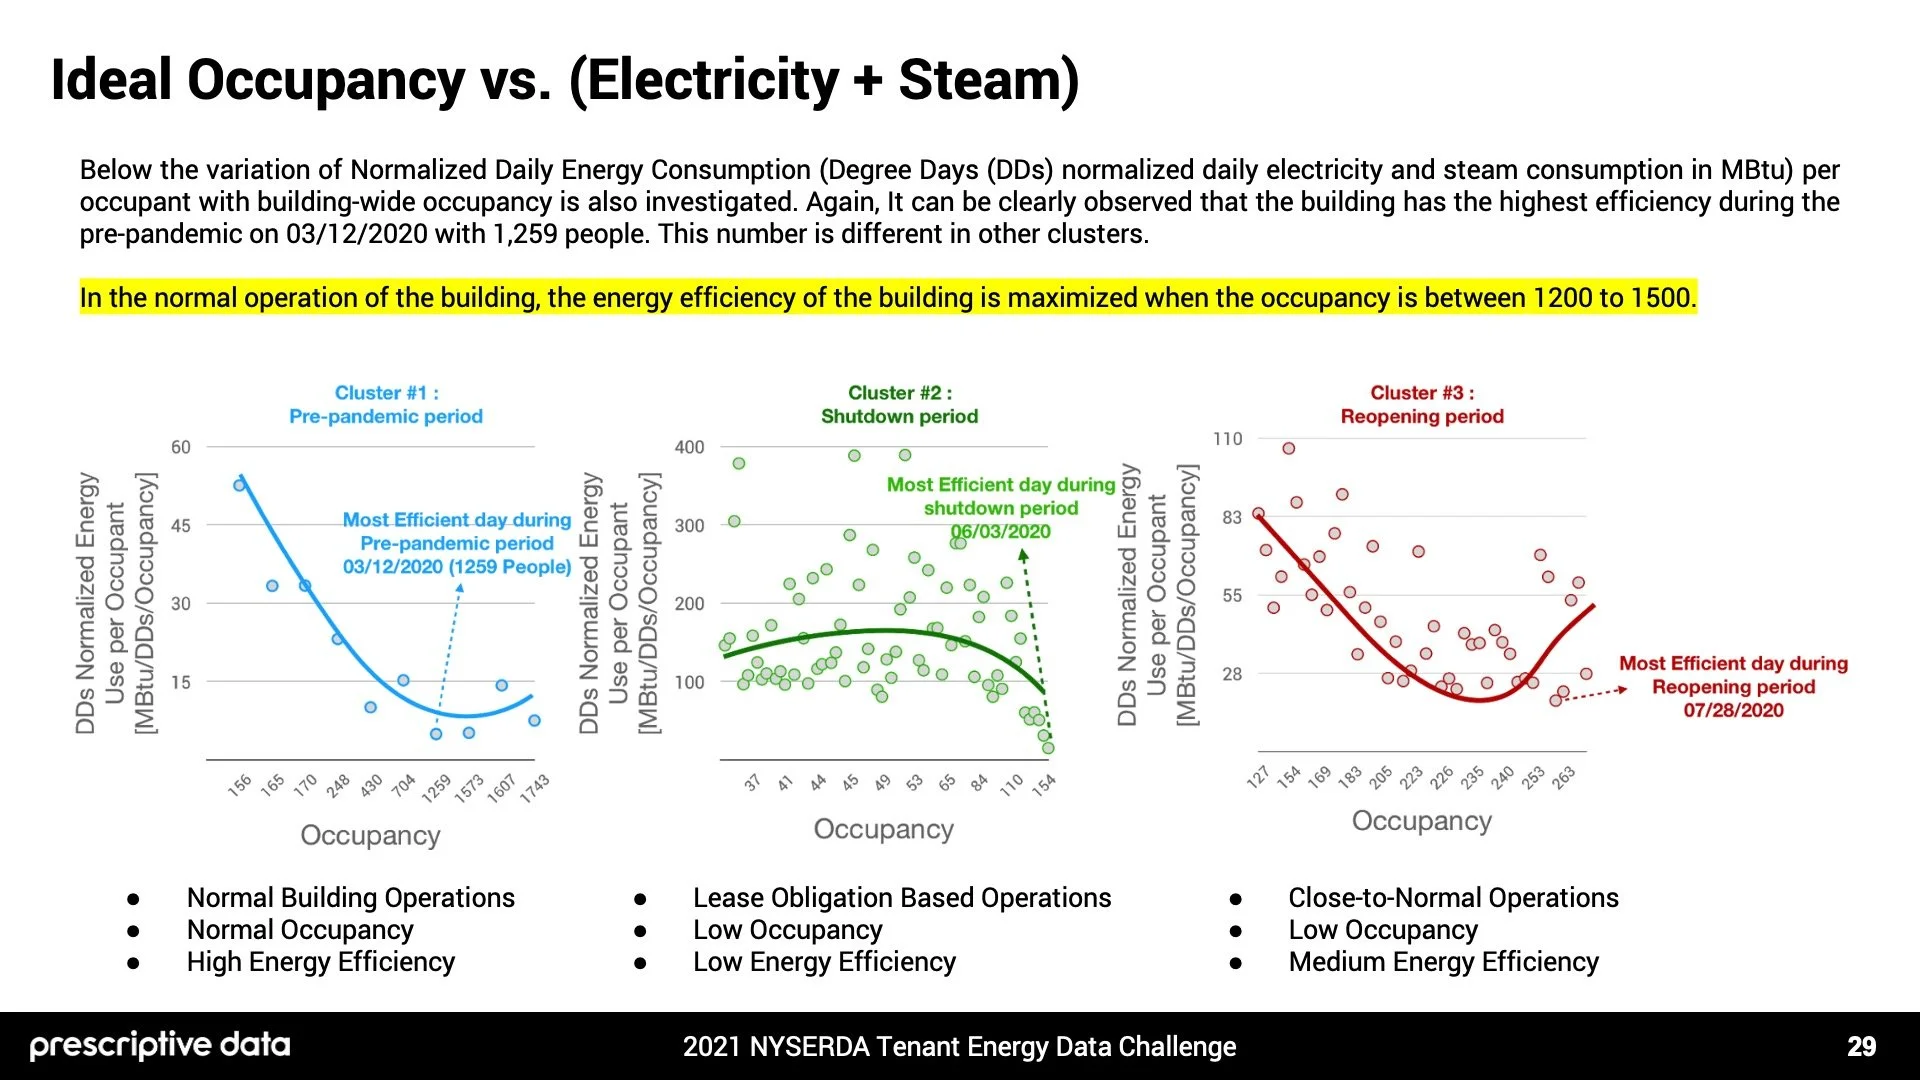
Combining electricity and steam usage, a similar weather normalized model is constructed and it can be concluded that the energy efficiency of the building is maximized when the occupancy is between 1200 to 1500.
Question 6 of 7
What else, if anything, can be concluded or constructed from your model?
(CLICK THE LEFT AND RIGHT ARROWS BELOW TO VIEW PRESENTATION SECTION)
Download: Full Presentation (PDF)
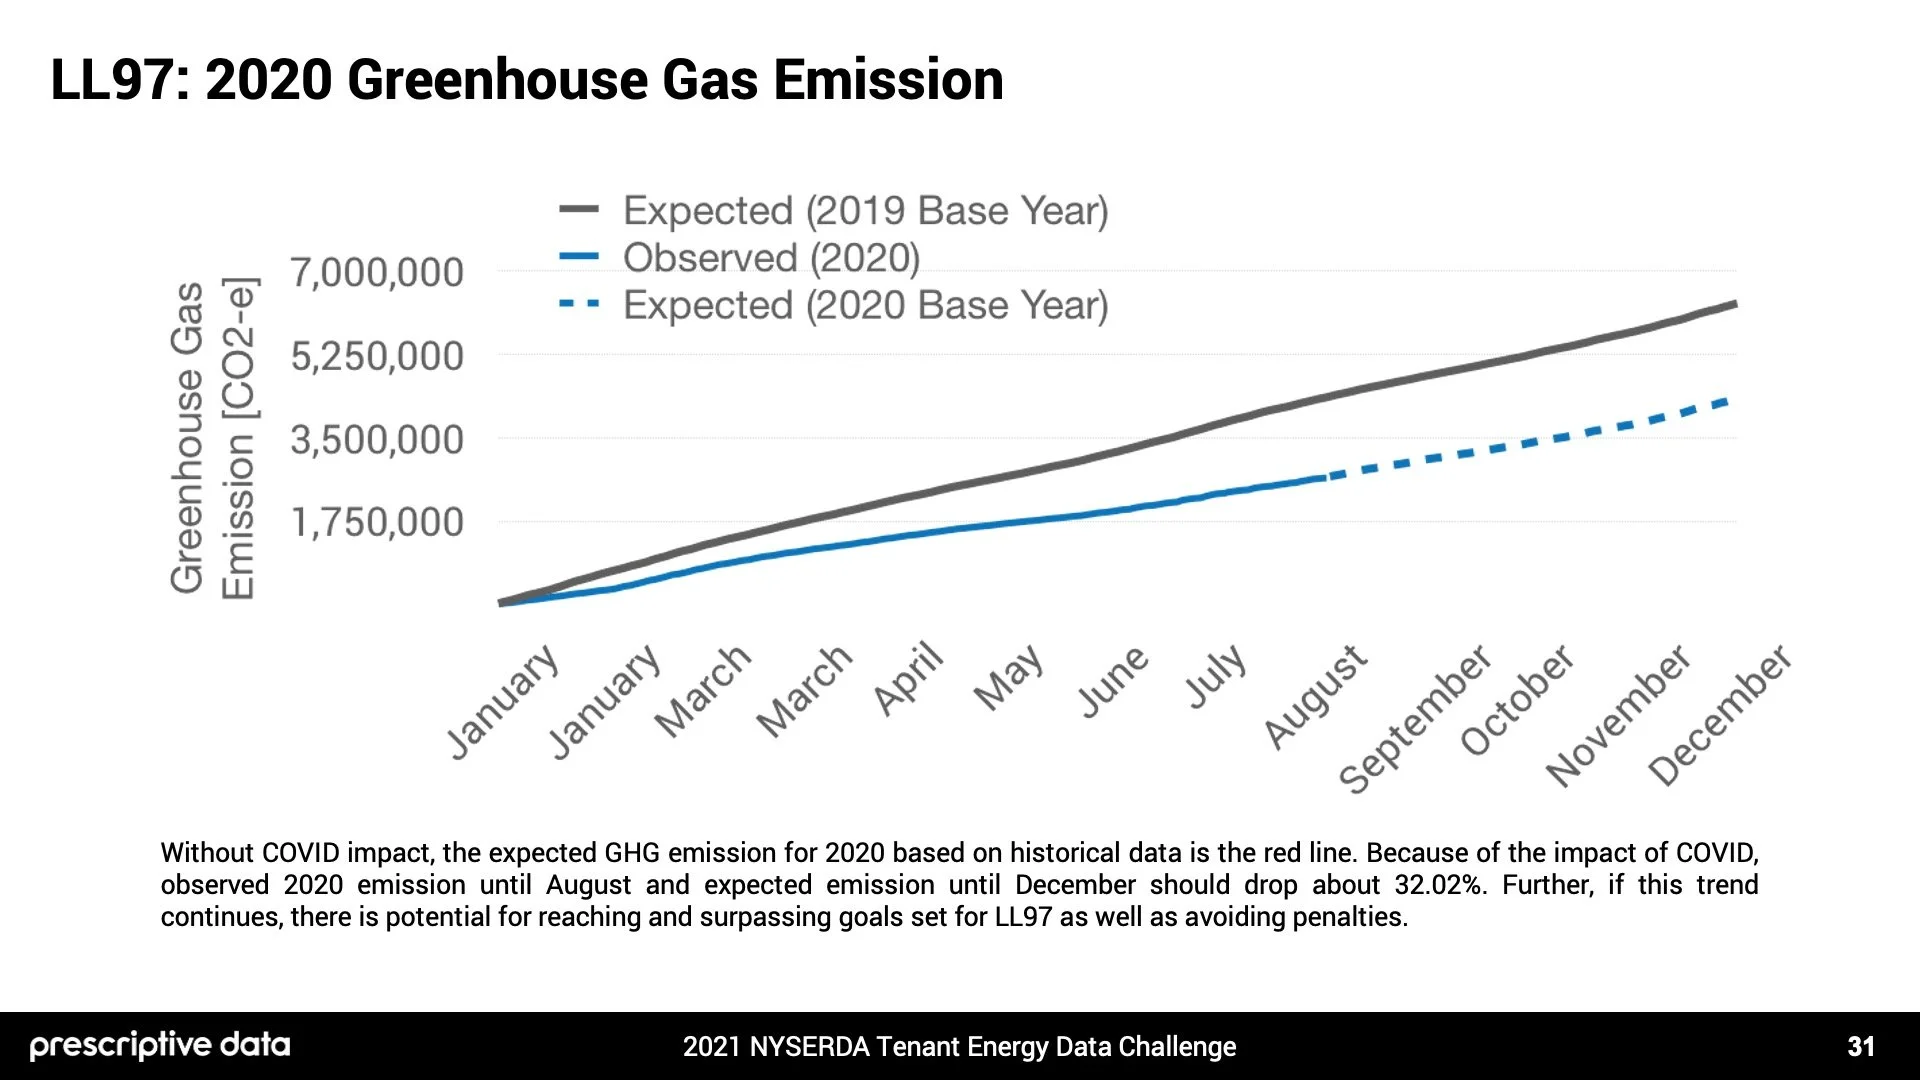
First, we performed an analysis on GHG emissions of the building. Without COVID impact, the expected GHG emission for 2020 based on historical data is modeled. Because of the impact of COVID, observed 2020 emission until August and expected emission until December should drop about 32.02%. Further, if this trend continues, there is potential for reaching and surpassing goals set for LL97 as well as avoiding penalties.
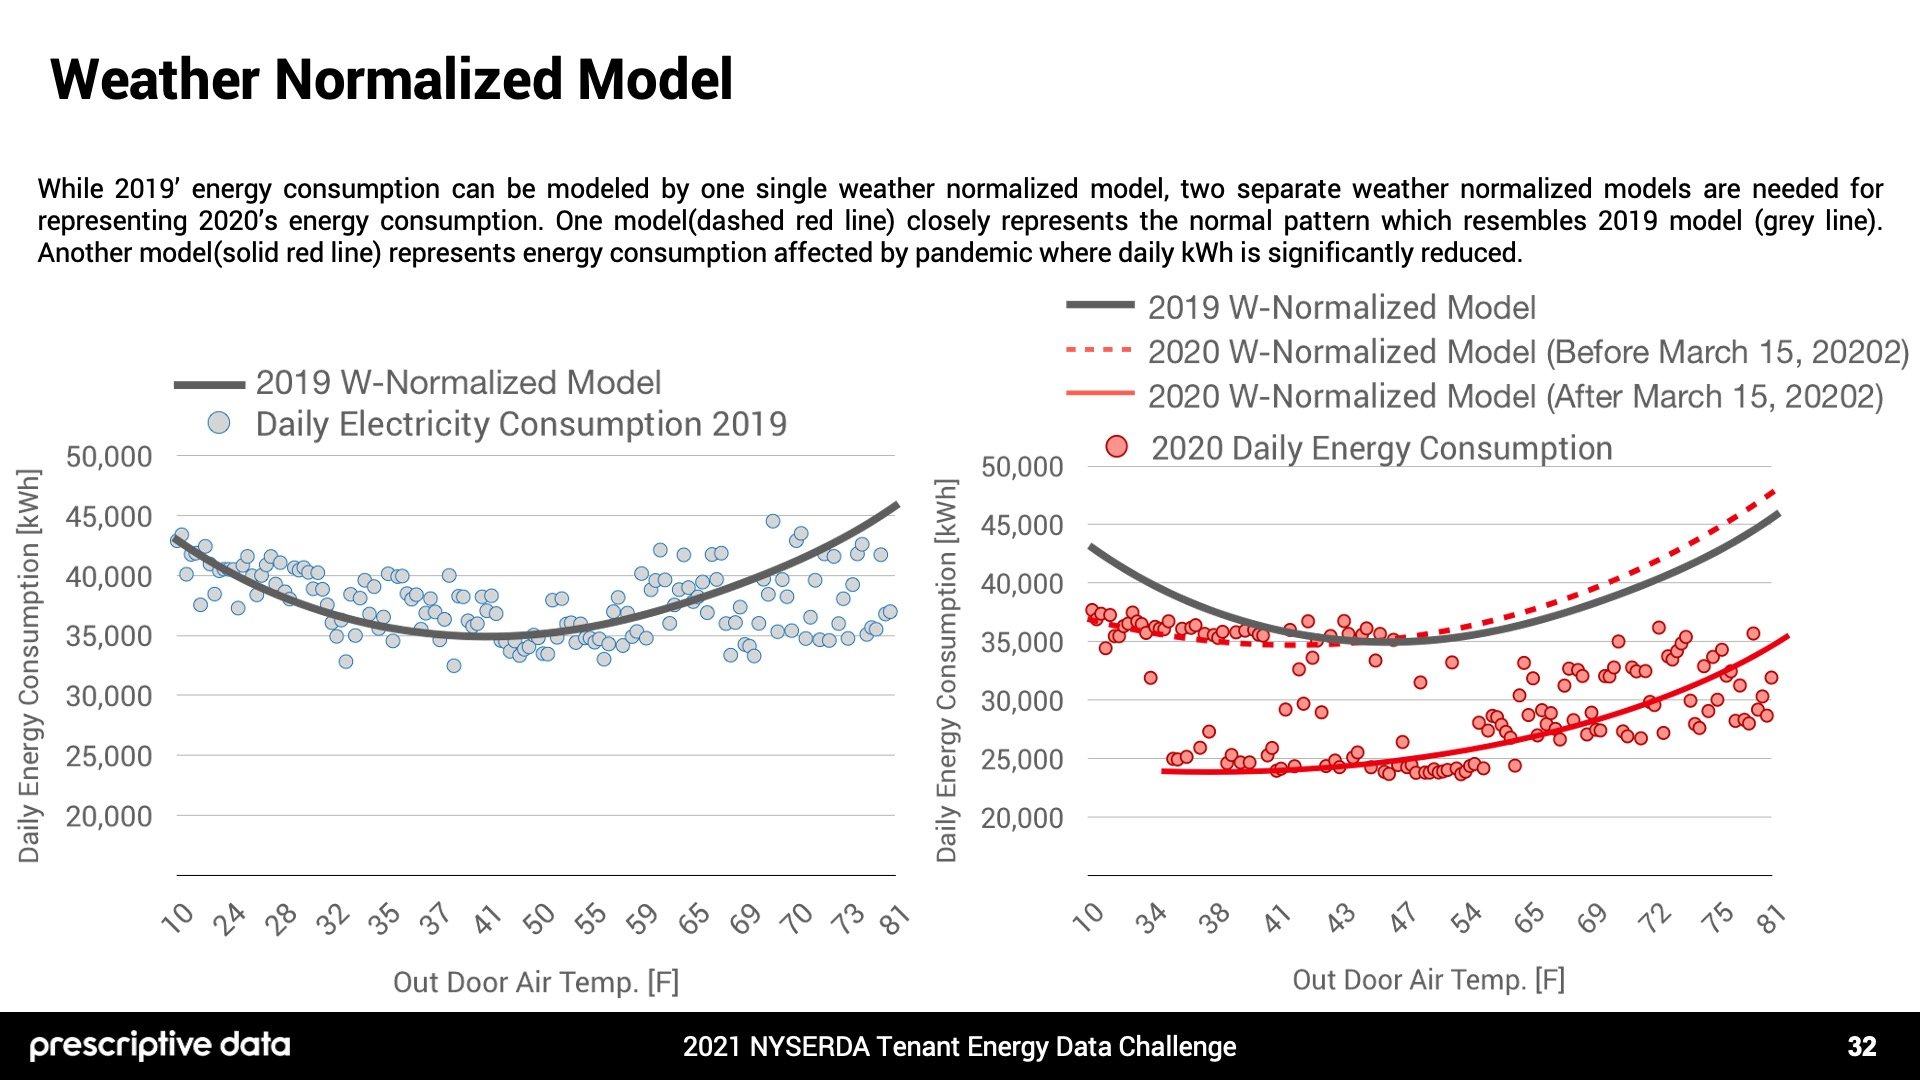
Second, we performed an analysis on weather normalized energy usage models. While 2019’ energy consumption can be modeled by one single weather normalized model, two separate weather normalized models are needed for representing 2020’s energy consumption. With one model closely represents the normal pattern which resembles the 2019 model, and another model(solid red line) represents energy consumption affected by COVID-19 where daily kWh is significantly reduced.
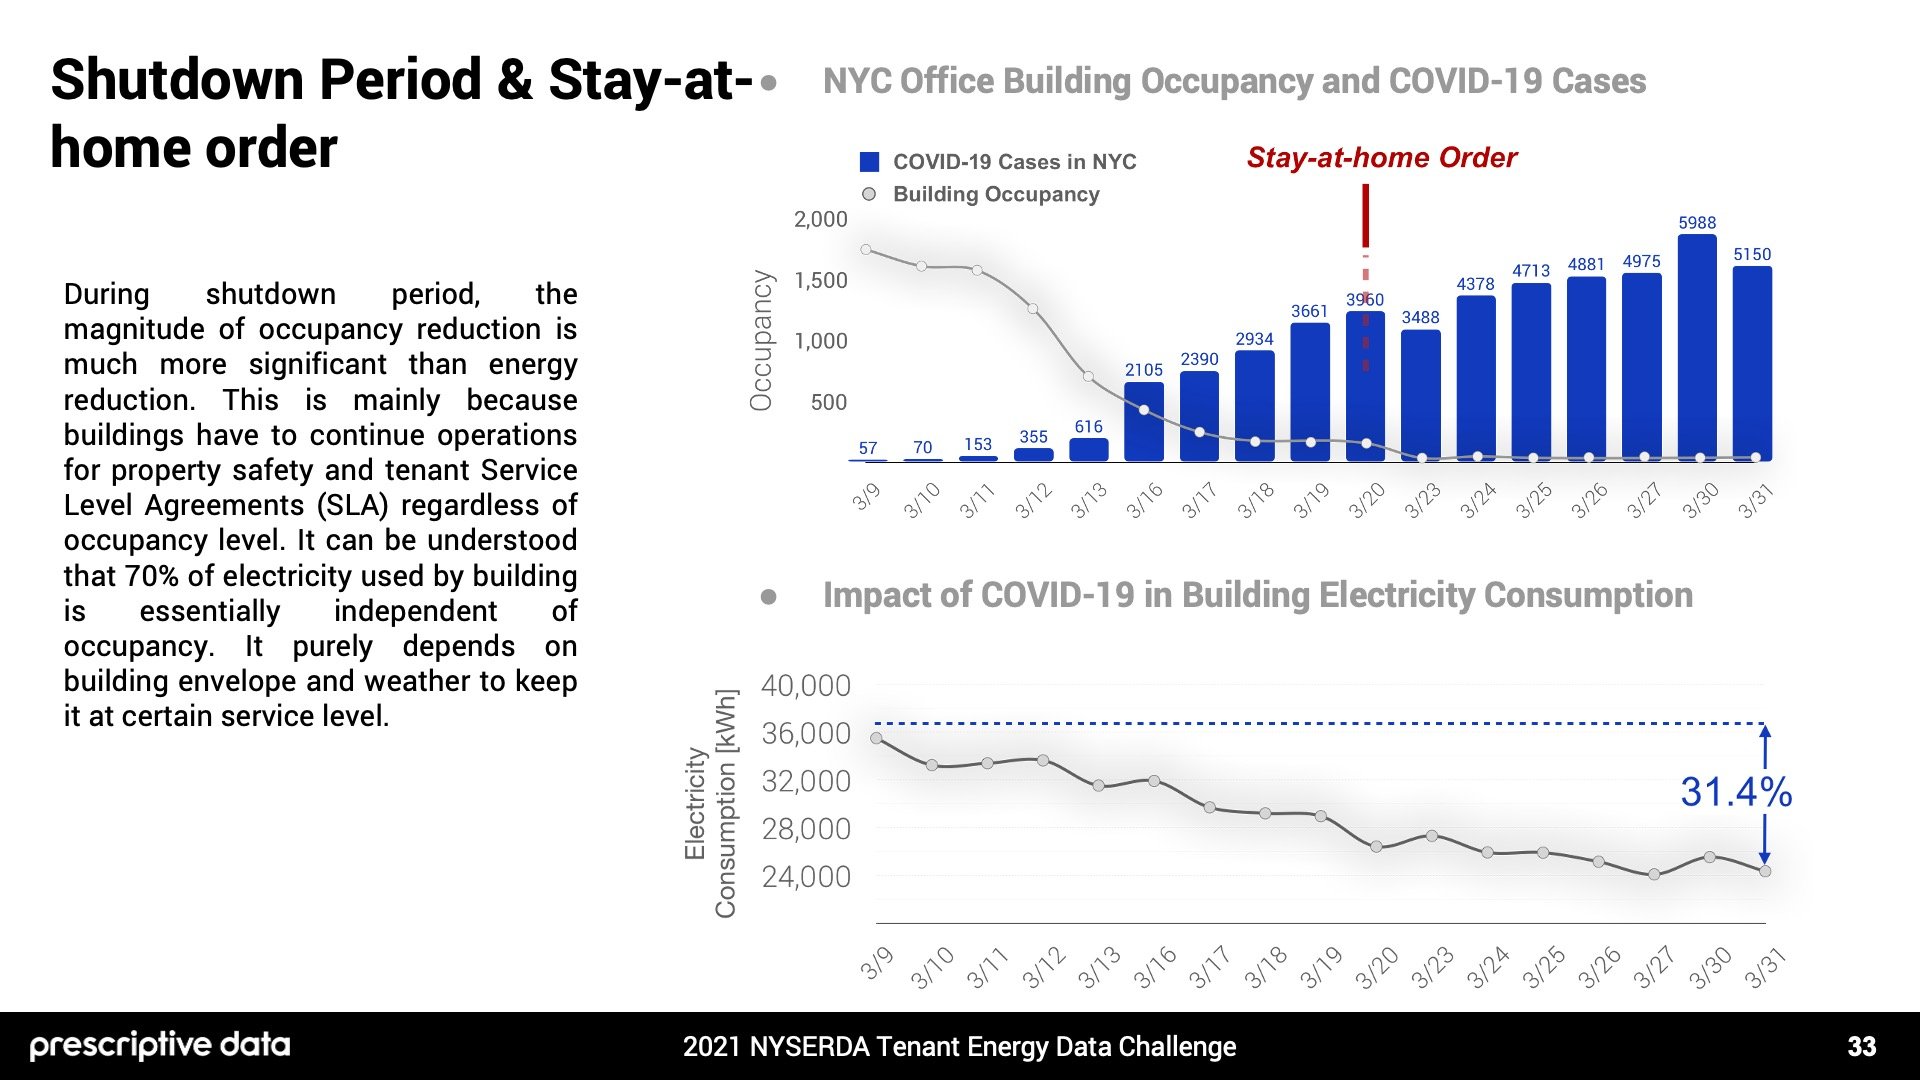
Third, we performed an analysis on building lease Service Level Agreement during COVID-19. During the shutdown period, the magnitude of occupancy reduction is much more significant than energy reduction. This is mainly because buildings have to continue operations for property safety and tenant Service Level Agreements (SLA) regardless of occupancy level. It can be understood that 70% of electricity used by buildings is essentially independent of occupancy. It purely depends on the building envelope and weather conditions to keep it at a certain service level.
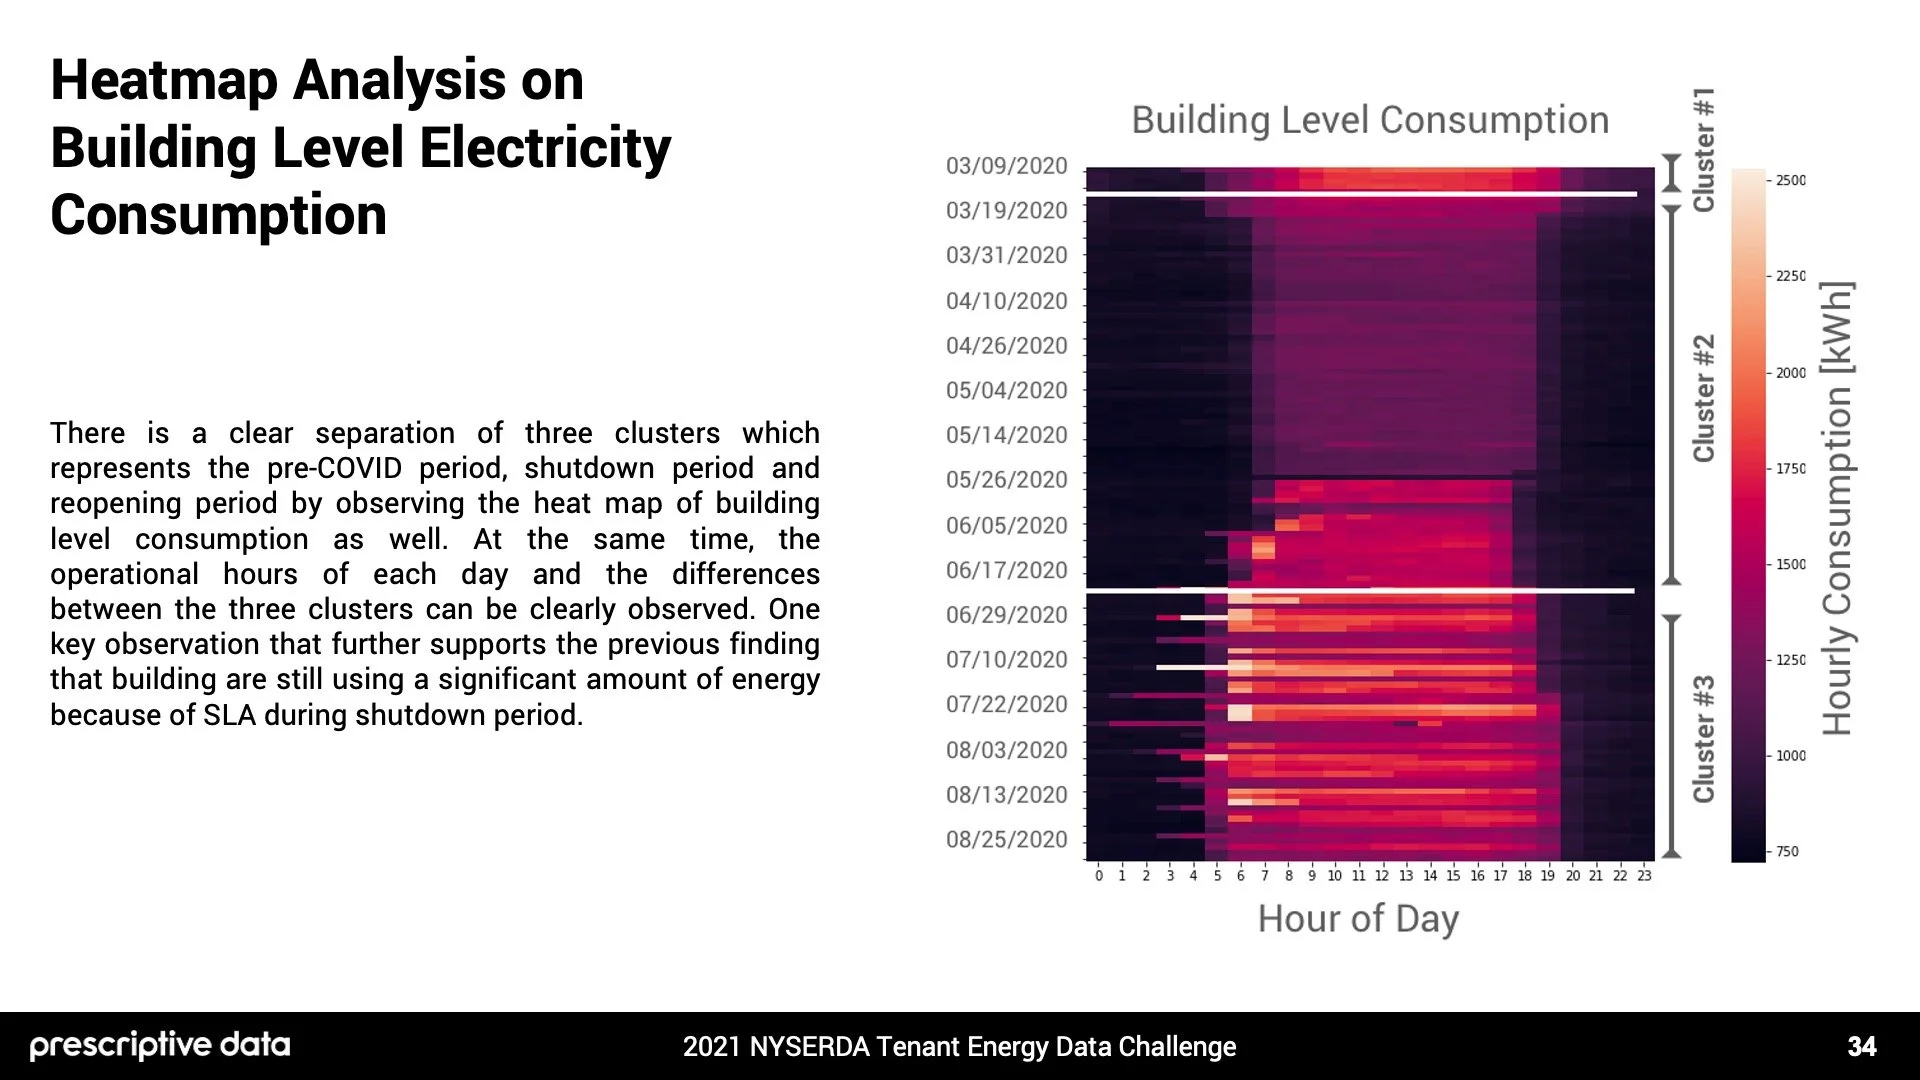
Fourth, we performed an analysis on building operational hours. There is a clear separation of three clusters which represents the pre-COVID period, shutdown period and reopening period by observing the heat map of building level consumption as well. At the same time, the operational hours of each day and the differences between the three clusters can be clearly observed. One key observation that further supports the previous finding of that building is still using a significant amount of energy because of SLA during the shutdown period.
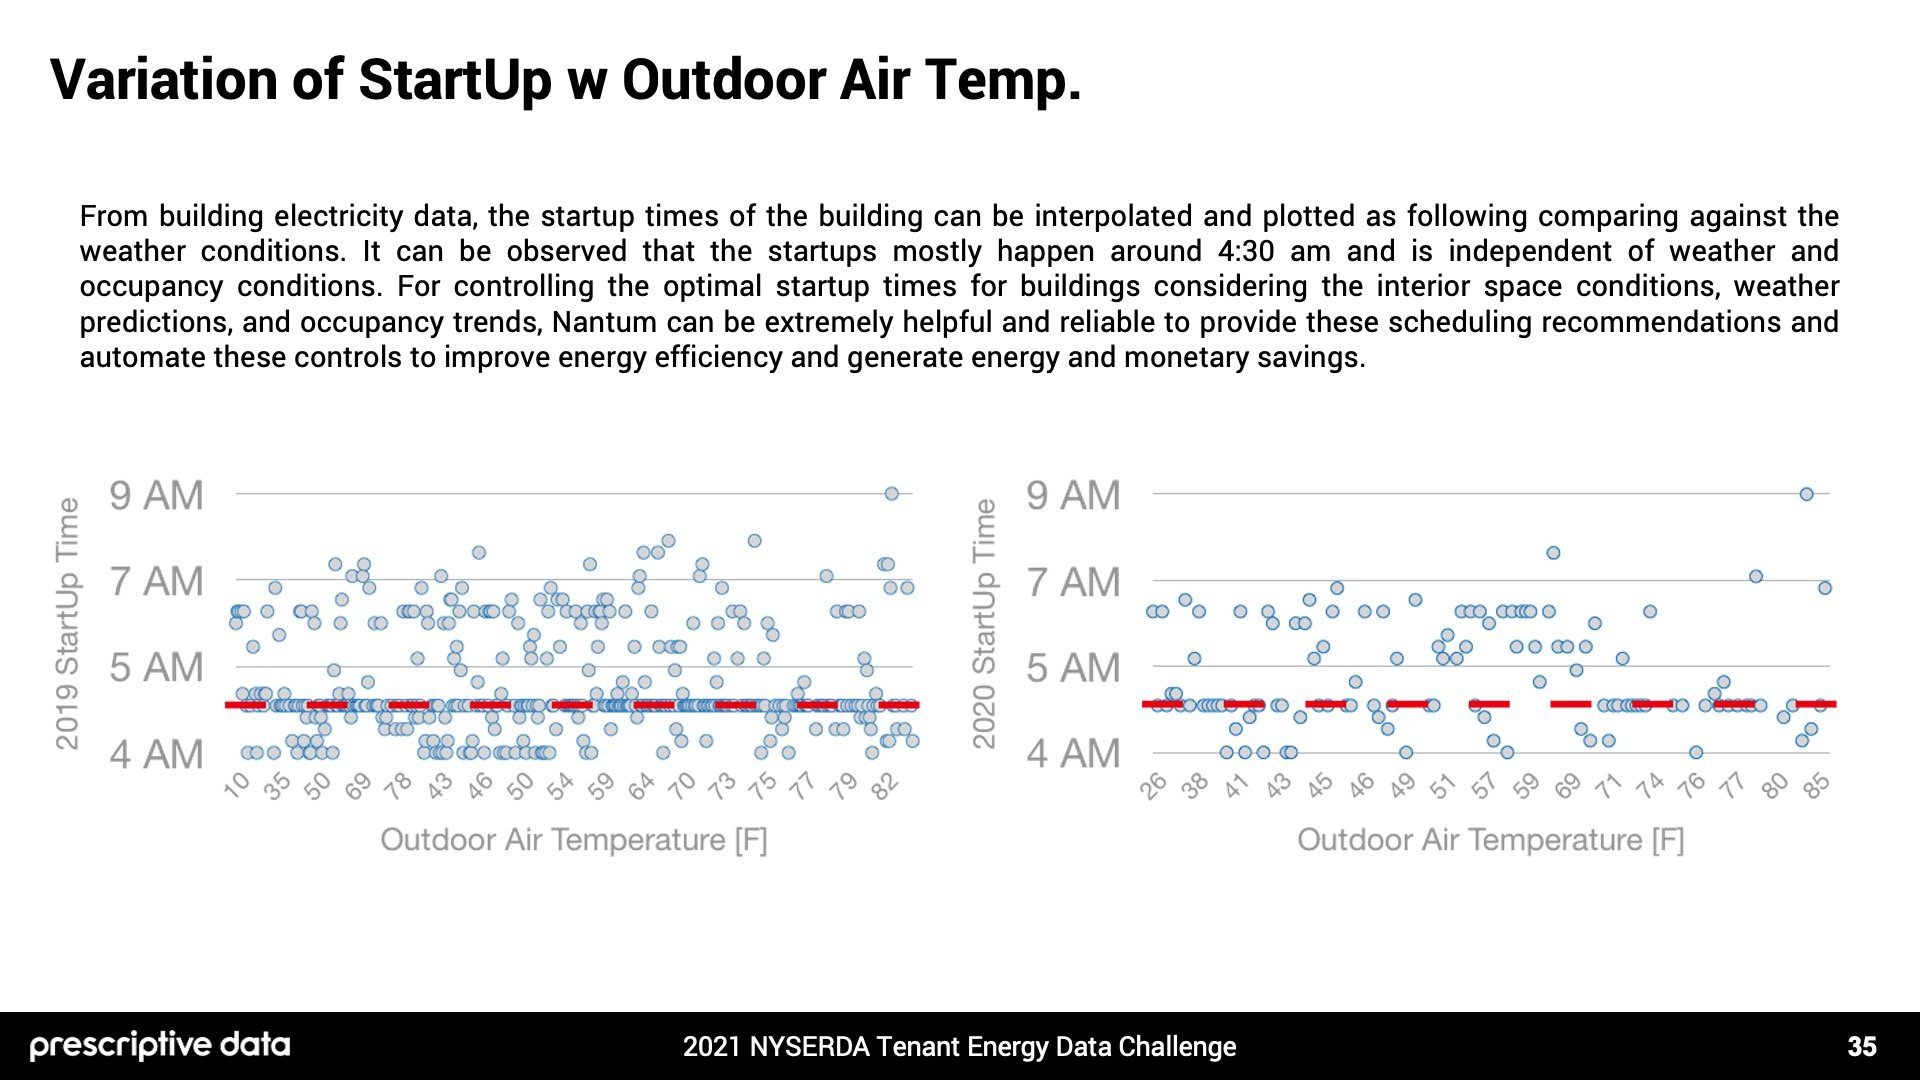
Lastly, we performed an analysis on variations in building BMS startup time based on outdoor temperature. From building electricity data, the startup times of the building can be interpolated and compared against the weather conditions. It can be observed that the startups mostly happen around 4:30 am and are independent of weather and occupancy conditions. For controlling the optimal startup times for buildings considering the interior space conditions, weather predictions, and occupancy trends, Nantum can be extremely helpful and reliable to provide these scheduling recommendations and automate these controls to improve energy efficiency and generate energy and monetary savings.
Question 7 of 7
What other information, if any, would you need to better your model?
(CLICK THE LEFT AND RIGHT ARROWS BELOW TO VIEW PRESENTATION SECTION)
Download: Full Presentation (PDF)
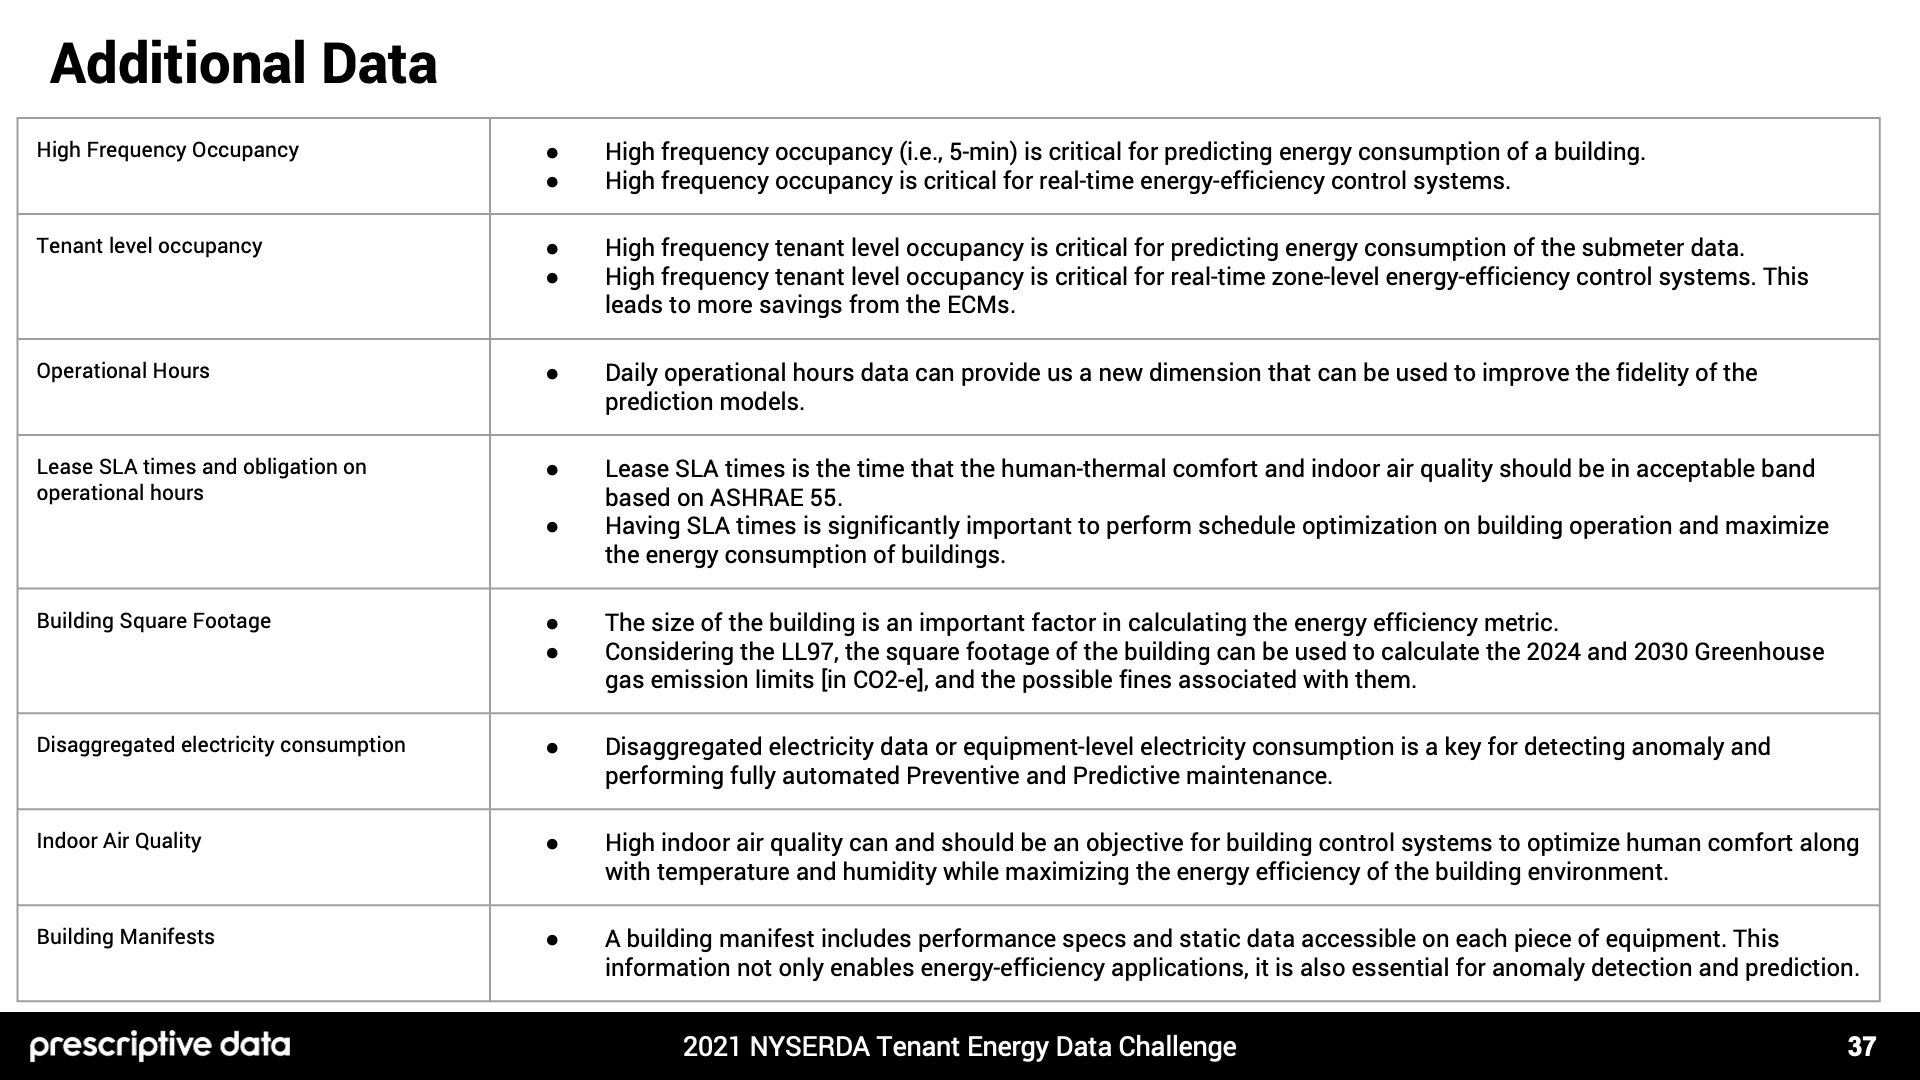
High Frequency Occupancy: High frequency occupancy (i.e., 5-min) is critical for predicting energy consumption of a building. It is critical for real-time energy-efficiency control systems.
Tenant level occupancy: High frequency tenant level occupancy is critical for predicting energy consumption of the submeter data.It is also critical for real-time zone-level energy-efficiency control systems which leads to more savings from the ECMs.
Operational Hours: Daily operational hours data can provide us a new dimension that can be used to improve the fidelity of the prediction models.
Lease SLA times and obligation on operational hours: Lease SLA times is the time that the human-thermal comfort and indoor air quality should be in acceptable band based on ASHRAE 55. Having SLA times is significantly important to perform schedule optimization on building operation and maximize the energy consumption of buildings.
Building Square Footage: The size of the building is an important factor in calculating the energy efficiency metric. Considering the LL97, the square footage of the building can be used to calculate the 2024 and 2030 Greenhouse gas emission limits [in CO2-e], and the possible fines associated with them.
Disaggregated electricity consumption: Disaggregated electricity data or equipment-level electricity consumption is a key for detecting anomaly and performing fully automated Preventive and Predictive maintenance.
Indoor Air Quality: High indoor air quality can and should be an objective for building control systems to optimize human comfort along with temperature and humidity while maximizing the energy efficiency of the building environment.
Building Manifests: A building manifest includes performance specs and static data accessible on each piece of equipment. This information not only enables energy-efficiency applications, it is also essential for anomaly detection and prediction.